How to Plot Multiple Plots in Matplotlib
Plot multiple plots in Matplotlib is an essential skill for data visualization in Python. This article will provide a detailed exploration of various techniques to create multiple plots using Matplotlib, one of the most popular plotting libraries in Python. We’ll cover everything from basic concepts to advanced techniques, helping you master the art of creating complex visualizations with multiple plots.
Introduction to Plotting Multiple Plots in Matplotlib
Plot multiple plots in Matplotlib allows you to display various data sets or different aspects of the same data side by side or in a grid layout. This technique is particularly useful when you want to compare different datasets, show trends over time, or present multiple views of the same information.
To get started with plotting multiple plots in Matplotlib, you’ll need to import the necessary libraries:
import matplotlib.pyplot as plt
import numpy as np
Now, let’s dive into the various methods to plot multiple plots in Matplotlib.
Using plt.subplots() to Create Multiple Plots
One of the most common ways to plot multiple plots in Matplotlib is by using the plt.subplots() function. This function creates a figure and a set of subplots in a single call.
Here’s a simple example to create two side-by-side plots:
import matplotlib.pyplot as plt
import numpy as np

x = np.linspace(0, 10, 100)
y1 = np.sin(x)
y2 = np.cos(x)

fig, (ax1, ax2) = plt.subplots(1, 2, figsize=(10, 4))

ax1.plot(x, y1)
ax1.set_title('Sine Wave - how2matplotlib.com')
ax2.plot(x, y2)
ax2.set_title('Cosine Wave - how2matplotlib.com')

plt.tight_layout()
plt.show()
Output:
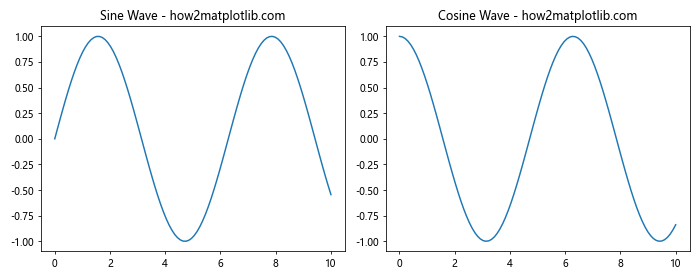
In this example, we create a figure with two subplots arranged horizontally. The figsize parameter sets the overall figure size. We then plot a sine wave on the first subplot and a cosine wave on the second subplot.
Creating a Grid of Plots
To plot multiple plots in Matplotlib in a grid layout, you can specify the number of rows and columns when calling plt.subplots():
import matplotlib.pyplot as plt
import numpy as np

fig, axs = plt.subplots(2, 2, figsize=(10, 8))

x = np.linspace(0, 10, 100)

axs[0, 0].plot(x, np.sin(x))
axs[0, 0].set_title('Sine - how2matplotlib.com')

axs[0, 1].plot(x, np.cos(x))
axs[0, 1].set_title('Cosine - how2matplotlib.com')

axs[1, 0].plot(x, np.tan(x))
axs[1, 0].set_title('Tangent - how2matplotlib.com')

axs[1, 1].plot(x, np.exp(x))
axs[1, 1].set_title('Exponential - how2matplotlib.com')

plt.tight_layout()
plt.show()
Output:
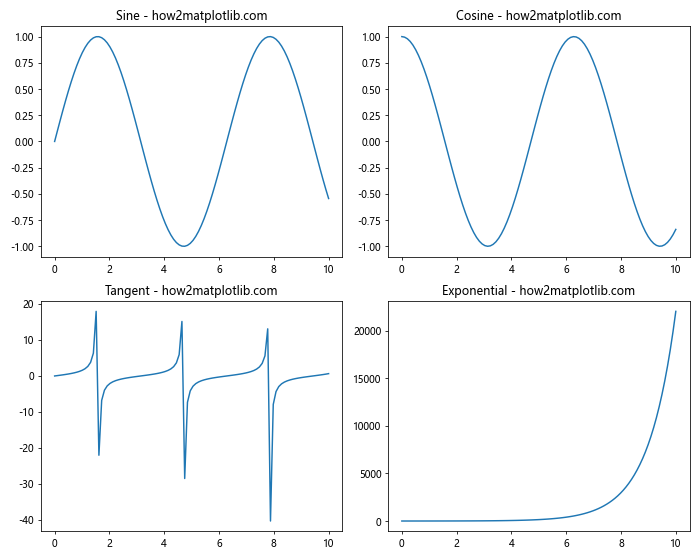
This code creates a 2×2 grid of plots, each displaying a different mathematical function.
Adjusting Subplot Layouts
When you plot multiple plots in Matplotlib, you might need to adjust the layout to ensure proper spacing and alignment. The plt.tight_layout() function is useful for this purpose, but you can also use gridspec for more fine-grained control:
import matplotlib.pyplot as plt
import matplotlib.gridspec as gridspec
import numpy as np

fig = plt.figure(figsize=(12, 8))
gs = gridspec.GridSpec(2, 3)

ax1 = fig.add_subplot(gs[0, :2])
ax2 = fig.add_subplot(gs[0, 2])
ax3 = fig.add_subplot(gs[1, :])

x = np.linspace(0, 10, 100)

ax1.plot(x, np.sin(x))
ax1.set_title('Sine Wave - how2matplotlib.com')

ax2.plot(x, np.cos(x))
ax2.set_title('Cosine Wave - how2matplotlib.com')

ax3.plot(x, np.tan(x))
ax3.set_title('Tangent Wave - how2matplotlib.com')

plt.tight_layout()
plt.show()
Output:
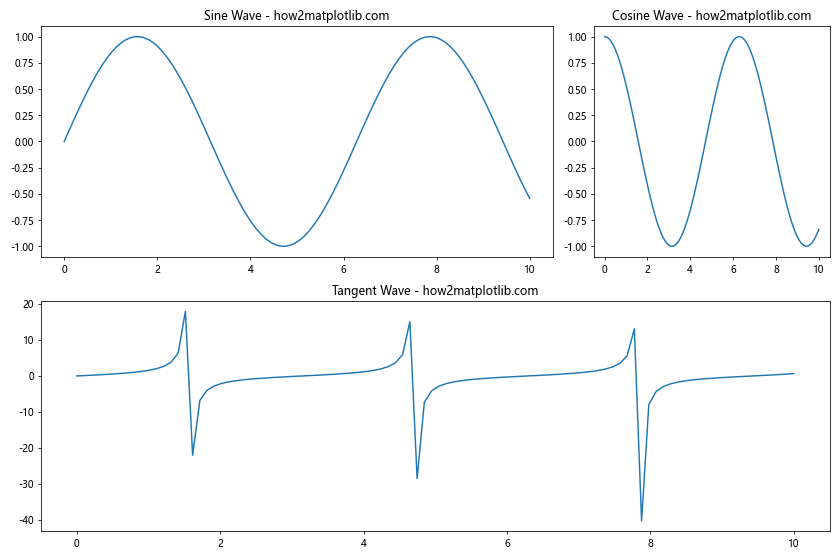
This example demonstrates how to create a custom layout with one large plot at the bottom and two plots of different sizes at the top.
Sharing Axes Between Subplots
When you plot multiple plots in Matplotlib, it’s often useful to share axes between subplots. This can be achieved using the sharex and sharey parameters in plt.subplots():
import matplotlib.pyplot as plt
import numpy as np

fig, (ax1, ax2) = plt.subplots(2, 1, sharex=True, figsize=(8, 6))

x = np.linspace(0, 10, 100)
y1 = np.sin(x)
y2 = np.cos(x)

ax1.plot(x, y1)
ax1.set_title('Sine Wave - how2matplotlib.com')

ax2.plot(x, y2)
ax2.set_title('Cosine Wave - how2matplotlib.com')

plt.tight_layout()
plt.show()
Output:
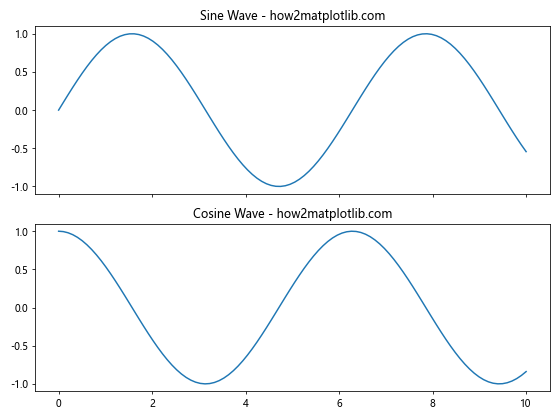
In this example, the x-axis is shared between the two subplots, which is useful for comparing data with the same x-range.
Adding a Colorbar to Multiple Plots
When you plot multiple plots in Matplotlib that involve color-coded data, you might want to add a colorbar. Here’s how you can add a single colorbar for multiple subplots:
import matplotlib.pyplot as plt
import numpy as np

fig, (ax1, ax2) = plt.subplots(1, 2, figsize=(10, 4))

x = np.linspace(-3, 3, 100)
y = np.linspace(-3, 3, 100)
X, Y = np.meshgrid(x, y)
Z1 = np.exp(-(X**2 + Y**2))
Z2 = np.exp(-((X-1)**2 + (Y-1)**2))

im1 = ax1.imshow(Z1, extent=[-3, 3, -3, 3], origin='lower')
ax1.set_title('Gaussian 1 - how2matplotlib.com')

im2 = ax2.imshow(Z2, extent=[-3, 3, -3, 3], origin='lower')
ax2.set_title('Gaussian 2 - how2matplotlib.com')

fig.colorbar(im1, ax=[ax1, ax2], label='Intensity')

plt.tight_layout()
plt.show()
Output:
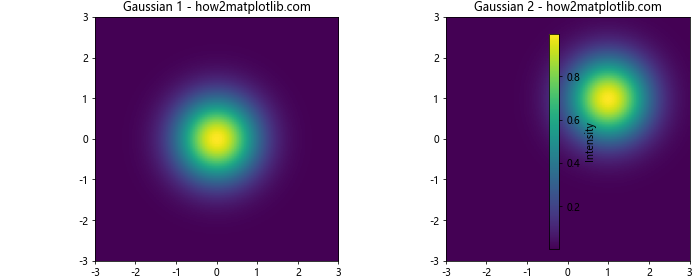
This code creates two heatmaps with a shared colorbar, demonstrating how to plot multiple plots in Matplotlib with a common color scale.
Creating Subplots with Different Sizes
Sometimes when you plot multiple plots in Matplotlib, you might want subplots of different sizes. The gridspec module allows for this level of customization:
import matplotlib.pyplot as plt
import matplotlib.gridspec as gridspec
import numpy as np

fig = plt.figure(figsize=(12, 8))
gs = gridspec.GridSpec(2, 2, width_ratios=[2, 1], height_ratios=[1, 2])

ax1 = fig.add_subplot(gs[0, 0])
ax2 = fig.add_subplot(gs[0, 1])
ax3 = fig.add_subplot(gs[1, :])

x = np.linspace(0, 10, 100)

ax1.plot(x, np.sin(x))
ax1.set_title('Sine - how2matplotlib.com')

ax2.plot(x, np.cos(x))
ax2.set_title('Cosine - how2matplotlib.com')

ax3.plot(x, np.tan(x))
ax3.set_title('Tangent - how2matplotlib.com')

plt.tight_layout()
plt.show()
Output:
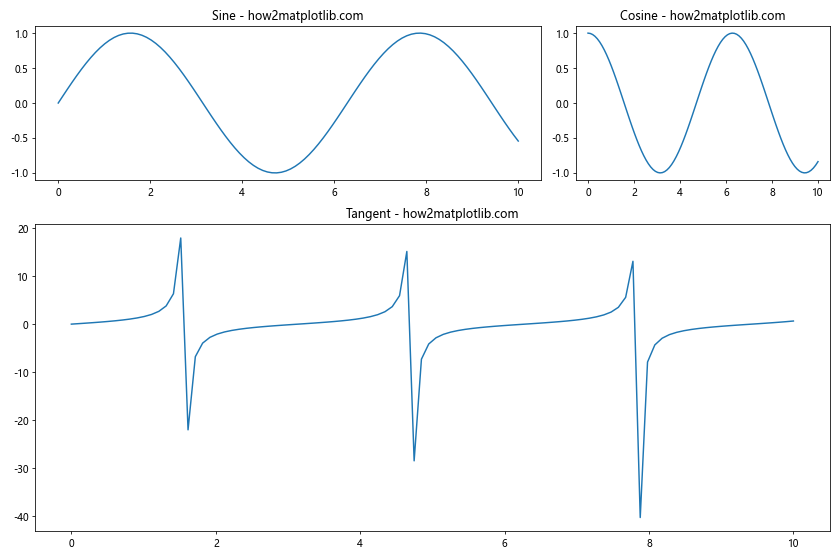
This example creates a layout with two smaller plots at the top and one larger plot at the bottom.
Overlaying Plots
Another technique to plot multiple plots in Matplotlib is by overlaying them on the same axes. This is useful for comparing different datasets directly:
import matplotlib.pyplot as plt
import numpy as np

x = np.linspace(0, 10, 100)
y1 = np.sin(x)
y2 = np.cos(x)

plt.figure(figsize=(8, 6))
plt.plot(x, y1, label='Sine - how2matplotlib.com')
plt.plot(x, y2, label='Cosine - how2matplotlib.com')
plt.title('Sine and Cosine Waves')
plt.legend()
plt.grid(True)
plt.show()
Output:
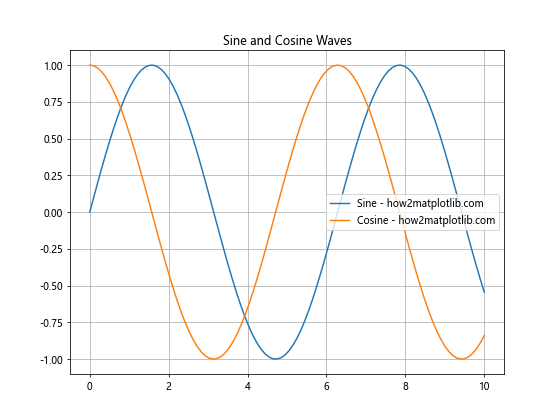
This code plots sine and cosine waves on the same axes, allowing for easy comparison.
Creating Subplots with plt.subplot()
While plt.subplots() is generally preferred, you can also use plt.subplot() to plot multiple plots in Matplotlib:
import matplotlib.pyplot as plt
import numpy as np

x = np.linspace(0, 10, 100)

plt.figure(figsize=(12, 4))

plt.subplot(131)
plt.plot(x, np.sin(x))
plt.title('Sine - how2matplotlib.com')

plt.subplot(132)
plt.plot(x, np.cos(x))
plt.title('Cosine - how2matplotlib.com')

plt.subplot(133)
plt.plot(x, np.tan(x))
plt.title('Tangent - how2matplotlib.com')

plt.tight_layout()
plt.show()
Output:
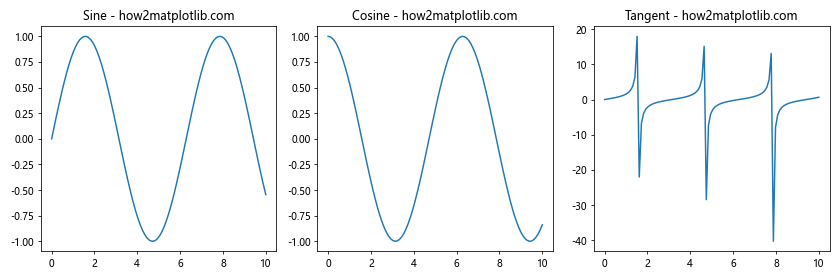
This method creates three subplots side by side, each showing a different trigonometric function.
Adding Inset Axes
When you plot multiple plots in Matplotlib, you might want to add smaller plots within a larger plot. This can be achieved using inset axes:
import matplotlib.pyplot as plt
import numpy as np

fig, ax = plt.subplots(figsize=(8, 6))

x = np.linspace(0, 10, 100)
y = np.sin(x)

ax.plot(x, y)
ax.set_title('Sine Wave with Inset - how2matplotlib.com')

# Create inset axes
axins = ax.inset_axes([0.5, 0.5, 0.47, 0.47])
axins.plot(x, y)
axins.set_xlim(2, 4)
axins.set_ylim(0.5, 1)
axins.set_xticklabels([])
axins.set_yticklabels([])

ax.indicate_inset_zoom(axins)

plt.show()
Output:
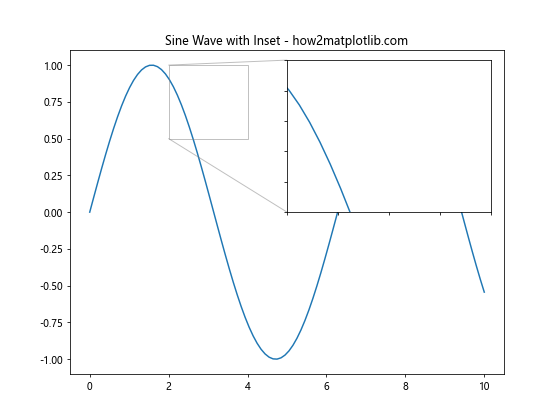
This example creates a main plot of a sine wave with an inset showing a zoomed-in portion of the wave.
Creating 3D Subplots
Matplotlib also allows you to plot multiple plots in 3D. Here’s an example of creating multiple 3D subplots:
import matplotlib.pyplot as plt
import numpy as np
from mpl_toolkits.mplot3d import Axes3D

fig = plt.figure(figsize=(12, 6))

ax1 = fig.add_subplot(121, projection='3d')
ax2 = fig.add_subplot(122, projection='3d')

x = np.linspace(-5, 5, 100)
y = np.linspace(-5, 5, 100)
X, Y = np.meshgrid(x, y)
Z1 = np.sin(np.sqrt(X**2 + Y**2))
Z2 = np.cos(np.sqrt(X**2 + Y**2))

ax1.plot_surface(X, Y, Z1)
ax1.set_title('3D Sine - how2matplotlib.com')

ax2.plot_surface(X, Y, Z2)
ax2.set_title('3D Cosine - how2matplotlib.com')

plt.tight_layout()
plt.show()
Output:
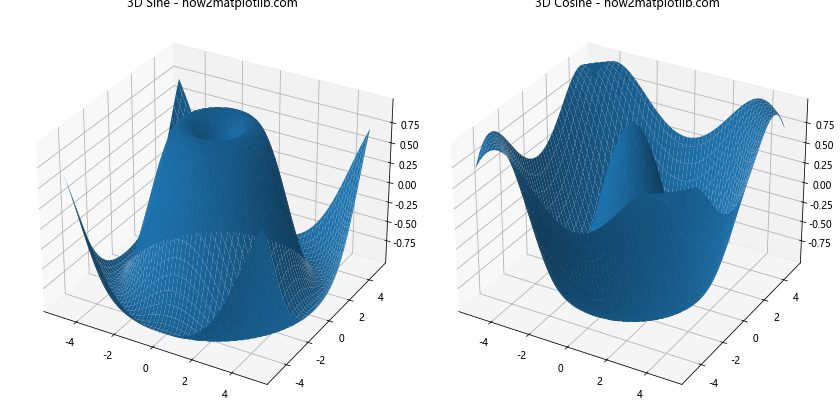
This code creates two 3D subplots, one showing a 3D sine function and the other a 3D cosine function.
Combining Different Types of Plots
When you plot multiple plots in Matplotlib, you’re not limited to using the same type of plot in each subplot. You can combine different types of plots:
import matplotlib.pyplot as plt
import numpy as np

fig, (ax1, ax2) = plt.subplots(1, 2, figsize=(12, 5))

x = np.linspace(0, 10, 100)
y = np.sin(x)

ax1.plot(x, y)
ax1.set_title('Line Plot - how2matplotlib.com')

ax2.scatter(x, y)
ax2.set_title('Scatter Plot - how2matplotlib.com')

plt.tight_layout()
plt.show()
Output:
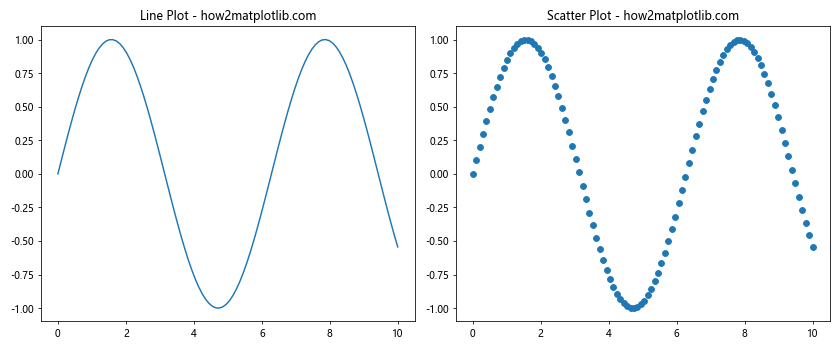
This example shows a line plot and a scatter plot side by side, demonstrating how to combine different plot types.
Creating Subplots with Different Scales
When you plot multiple plots in Matplotlib, you might need to use different scales for different subplots:
import matplotlib.pyplot as plt
import numpy as np

fig, (ax1, ax2) = plt.subplots(1, 2, figsize=(12, 5))

x = np.linspace(0, 10, 100)
y1 = np.exp(x)
y2 = np.sin(x)

ax1.plot(x, y1)
ax1.set_yscale('log')
ax1.set_title('Exponential (Log Scale) - how2matplotlib.com')

ax2.plot(x, y2)
ax2.set_title('Sine (Linear Scale) - how2matplotlib.com')

plt.tight_layout()
plt.show()
Output:
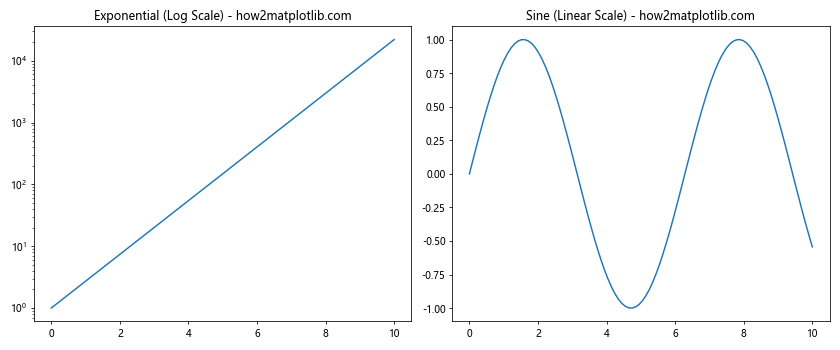
This code creates two subplots: one with a logarithmic y-scale for an exponential function, and another with a linear scale for a sine function.
Adding Annotations to Multiple Plots
When you plot multiple plots in Matplotlib, you might want to add annotations to highlight specific points or regions:
import matplotlib.pyplot as plt
import numpy as np

fig, (ax1, ax2) = plt.subplots(1, 2, figsize=(12, 5))

x = np.linspace(0, 10, 100)
y1 = np.sin(x)
y2 = np.cos(x)

ax1.plot(x, y1)
ax1.set_title('Sine Wave - how2matplotlib.com')
ax1.annotate('Peak', xy=(np.pi/2, 1), xytext=(np.pi/2, 0.5),
             arrowprops=dict(facecolor='black', shrink=0.05))

ax2.plot(x, y2)
ax2.set_title('Cosine Wave - how2matplotlib.com')
ax2.annotate('Trough', xy=(np.pi, -1), xytext=(np.pi, -0.5),
             arrowprops=dict(facecolor='black', shrink=0.05))

plt.tight_layout()
plt.show()
Output:
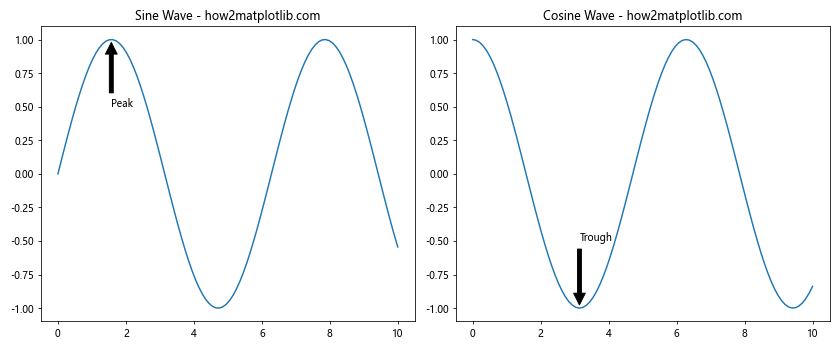
This example adds annotations to highlight the peak of a sine wave and the trough of a cosine wave.
Creating a Dashboard-like Layout
You can plot multiple plots in Matplotlib to create a dashboard-like layout, combining different types of visualizations:
import matplotlib.pyplot as plt
import numpy as np

fig = plt.figure(figsize=(12, 8))
gs = fig.add_gridspec(2, 3)

ax1 = fig.add_subplot(gs[0, 0])
ax2 = fig.add_subplot(gs[0, 1:])
ax3 = fig.add_subplot(gs[1, :2])
ax4 = fig.add_subplot(gs[1, 2])

x = np.linspace(0, 10, 100)
y1 = np.sin(x)
y2 = np.cos(x)

ax1.bar(['A', 'B', 'C', 'D'], [3, 7, 2, 5])
ax1.set_title('Bar Chart - how2matplotlib.com')

ax2.plot(x, y1, label='Sine')
ax2.plot(x, y2, label='Cosine')
ax2.legend()
ax2.set_title('Line Plot - how2matplotlib.com')

ax3.scatter(x, y1, c=y2, cmap='viridis')
ax3.set_title('Scatter Plot - how2matplotlib.com')

ax4.hist2d(y1, y2, bins=20, cmap='Blues')
ax4.set_title('2D Histogram - how2matplotlib.com')

plt.tight_layout()
plt.show()
Output:
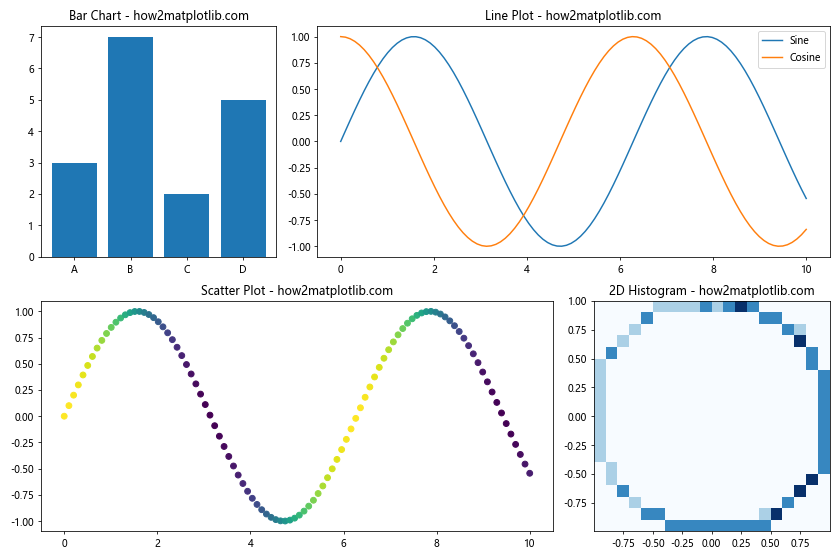
This example creates a dashboard-like layout with four different types of plots: a bar chart, a line plot, a scatter plot, and a 2D histogram.
Customizing Subplot Spacing
When you plot multiple plots in Matplotlib, you might need to adjust the spacing between subplots. The subplots_adjust() function allows for fine-tuning of subplot layout:
import matplotlib.pyplot as plt
import numpy as np

fig, axs = plt.subplots(2, 2, figsize=(10, 8))

x = np.linspace(0, 10, 100)

axs[0, 0].plot(x, np.sin(x))
axs[0, 0].set_title('Sine - how2matplotlib.com')

axs[0, 1].plot(x, np.cos(x))
axs[0, 1].set_title('Cosine - how2matplotlib.com')

axs[1, 0].plot(x, np.tan(x))
axs[1, 0].set_title('Tangent - how2matplotlib.com')

axs[1, 1].plot(x, np.exp(x))
axs[1, 1].set_title('Exponential - how2matplotlib.com')

plt.subplots_adjust(left=0.1, right=0.95, top=0.95, bottom=0.05, wspace=0.3, hspace=0.4)
plt.show()
Output:
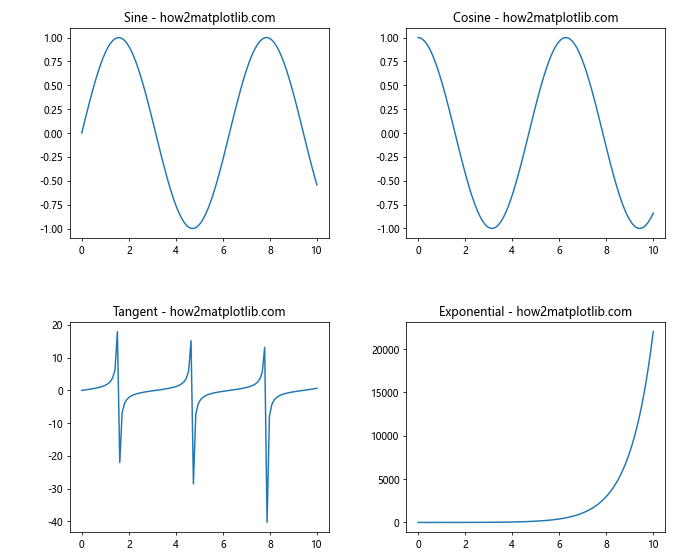
This code creates a 2×2 grid of plots and adjusts the spacing between them using subplots_adjust().
Creating Subplots with Shared Colorbar
When you plot multiple plots in Matplotlib that use color mapping, you might want to use a shared colorbar:
import matplotlib.pyplot as plt
import numpy as np
from mpl_toolkits.axes_grid1 import make_axes_locatable

fig, (ax1, ax2) = plt.subplots(1, 2, figsize=(12, 5))

x = np.linspace(-3, 3, 100)
y = np.linspace(-3, 3, 100)
X, Y = np.meshgrid(x, y)
Z1 = np.sin(X) * np.cos(Y)
Z2 = np.cos(X) * np.sin(Y)

im1 = ax1.imshow(Z1, extent=[-3, 3, -3, 3], origin='lower', cmap='viridis')
ax1.set_title('Plot 1 - how2matplotlib.com')

im2 = ax2.imshow(Z2, extent=[-3, 3, -3, 3], origin='lower', cmap='viridis')
ax2.set_title('Plot 2 - how2matplotlib.com')

fig.subplots_adjust(right=0.8)
cbar_ax = fig.add_axes([0.85, 0.15, 0.05, 0.7])
fig.colorbar(im1, cax=cbar_ax)

plt.show()
Output:
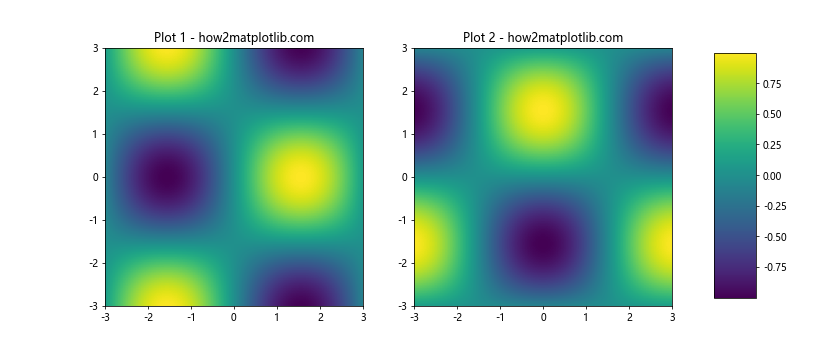
This example creates two heatmaps with a shared colorbar on the right side of the figure.
Creating a Plot with Subplots and a Main Title
When you plot multiple plots in Matplotlib, you might want to add a main title for the entire figure:
import matplotlib.pyplot as plt
import numpy as np

fig, axs = plt.subplots(2, 2, figsize=(10, 8))
fig.suptitle('Trigonometric Functions - how2matplotlib.com', fontsize=16)

x = np.linspace(0, 10, 100)

axs[0, 0].plot(x, np.sin(x))
axs[0, 0].set_title('Sine')

axs[0, 1].plot(x, np.cos(x))
axs[0, 1].set_title('Cosine')

axs[1, 0].plot(x, np.tan(x))
axs[1, 0].set_title('Tangent')

axs[1, 1].plot(x, 1 / np.cos(x))
axs[1, 1].set_title('Secant')

plt.tight_layout()
plt.show()
Output:
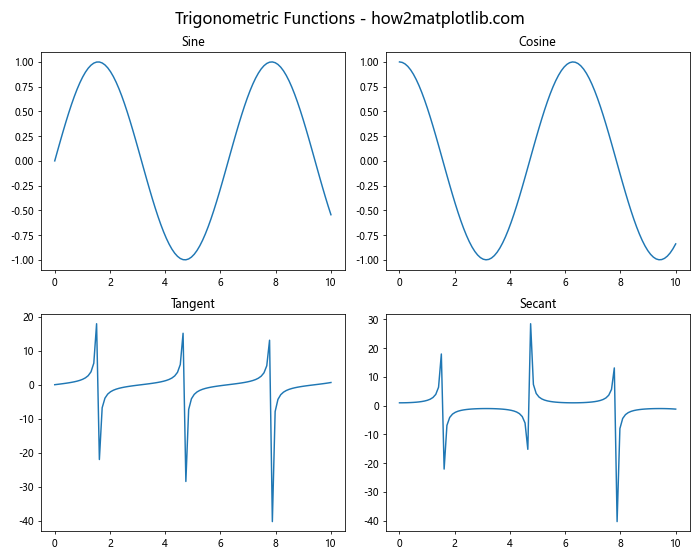
This code creates a 2×2 grid of plots with a main title for the entire figure.
Conclusion
In this comprehensive guide, we’ve explored various techniques to plot multiple plots in Matplotlib. From basic side-by-side plots to complex grid layouts, 3D visualizations, and dashboard-like arrangements, Matplotlib offers a wide range of options for creating multi-plot figures.
Key takeaways include:
- Using
plt.subplots()for creating multiple plots efficiently. - Customizing layouts with
gridspecfor more control over plot arrangements. - Sharing axes between subplots for better data comparison.
- Adding colorbars to multiple plots for consistent color mapping.
- Creating subplots of different sizes to emphasize certain plots.
- Overlaying plots for direct data comparison.
- Using inset axes to show detailed views within larger plots.
- Combining different types of plots in a single figure.
- Adjusting scales and adding annotations to enhance plot readability.
- Creating dashboard-like layouts for comprehensive data visualization.
By mastering these techniques to plot multiple plots in Matplotlib, you’ll be able to create more informative and visually appealing data visualizations. Remember to experiment with different layouts and combinations to find the best way to present your data effectively.