How to Rotate Axis Tick Labels in Seaborn and Matplotlib
Rotate axis tick labels in Seaborn and Matplotlib is an essential skill for data visualization enthusiasts and professionals alike. This article will delve deep into the various methods and techniques to rotate axis tick labels using both Seaborn and Matplotlib libraries. We’ll explore the importance of rotating tick labels, different approaches to achieve this, and provide numerous examples to help you master this crucial aspect of data visualization.
Understanding the Need to Rotate Axis Tick Labels in Seaborn and Matplotlib
Before we dive into the specifics of how to rotate axis tick labels in Seaborn and Matplotlib, it’s important to understand why this technique is so valuable. When working with data visualization, especially with categorical data or long labels, the default horizontal orientation of tick labels can often lead to overlapping or cluttered axis labels. This can make your plots difficult to read and interpret. By rotating axis tick labels, you can:
- Improve readability: Rotated labels prevent overlapping and make it easier for viewers to read each label clearly.
- Optimize space: Vertical or angled labels can save horizontal space, allowing for more compact visualizations.
- Enhance aesthetics: Properly rotated labels can make your plots look more professional and polished.
Now that we understand the importance of rotating axis tick labels, let’s explore how to accomplish this in both Seaborn and Matplotlib.
Rotating Axis Tick Labels in Matplotlib
Matplotlib is a powerful plotting library that serves as the foundation for many other visualization libraries, including Seaborn. Let’s start by examining how to rotate axis tick labels in Matplotlib.
Basic Rotation of X-axis Labels
To rotate x-axis tick labels in Matplotlib, we can use the set_xticklabels() method along with the rotation parameter. Here’s a simple example:
import matplotlib.pyplot as plt

# Sample data
x = ['A', 'B', 'C', 'D', 'E']
y = [1, 2, 3, 4, 5]

# Create the plot
plt.figure(figsize=(8, 6))
plt.bar(x, y)

# Rotate x-axis labels
plt.xticks(rotation=45)

# Add labels and title
plt.xlabel('Categories')
plt.ylabel('Values')
plt.title('Bar Plot with Rotated X-axis Labels - how2matplotlib.com')

# Show the plot
plt.tight_layout()
plt.show()
Output:
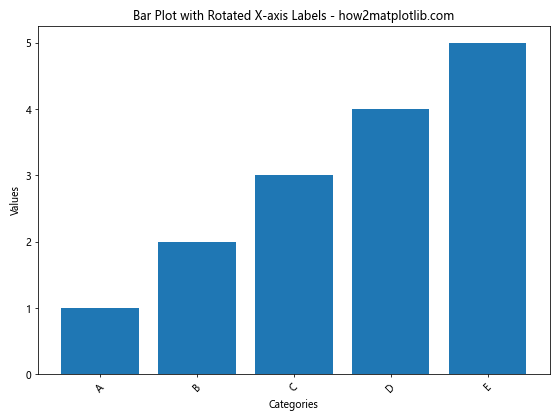
In this example, we create a simple bar plot and use plt.xticks(rotation=45) to rotate the x-axis labels by 45 degrees. The rotation parameter can be set to any angle between 0 and 360 degrees.
Rotating Y-axis Labels
Similarly, we can rotate y-axis labels using the set_yticklabels() method. Here’s an example:
import matplotlib.pyplot as plt

# Sample data
x = [1, 2, 3, 4, 5]
y = ['Category A', 'Category B', 'Category C', 'Category D', 'Category E']

# Create the plot
plt.figure(figsize=(8, 6))
plt.barh(y, x)

# Rotate y-axis labels
plt.yticks(rotation=0)

# Add labels and title
plt.xlabel('Values')
plt.ylabel('Categories')
plt.title('Horizontal Bar Plot with Rotated Y-axis Labels - how2matplotlib.com')

# Show the plot
plt.tight_layout()
plt.show()
Output:
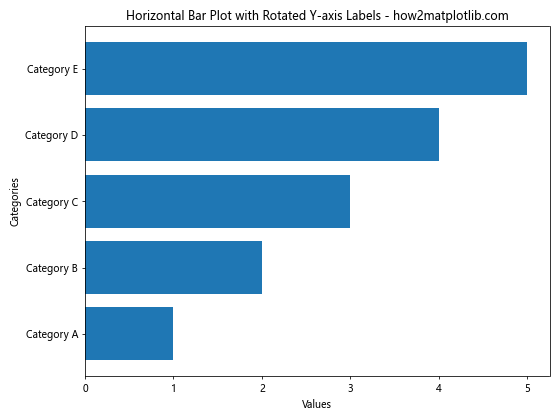
In this case, we create a horizontal bar plot and use plt.yticks(rotation=0) to ensure the y-axis labels remain horizontal. You can adjust the rotation angle as needed.
Fine-tuning Label Rotation
For more precise control over label rotation, you can use the set_xticklabels() or set_yticklabels() methods with additional parameters. Here’s an example that demonstrates this:
import matplotlib.pyplot as plt

# Sample data
x = ['Long Label 1', 'Long Label 2', 'Long Label 3', 'Long Label 4', 'Long Label 5']
y = [1, 2, 3, 4, 5]

# Create the plot
fig, ax = plt.subplots(figsize=(10, 6))
ax.bar(x, y)

# Rotate and align the tick labels so they look better
ax.set_xticklabels(x, rotation=45, ha='right')

# Add labels and title
ax.set_xlabel('Categories')
ax.set_ylabel('Values')
ax.set_title('Bar Plot with Fine-tuned X-axis Label Rotation - how2matplotlib.com')

# Adjust the subplot layout
plt.tight_layout()

# Show the plot
plt.show()
Output:
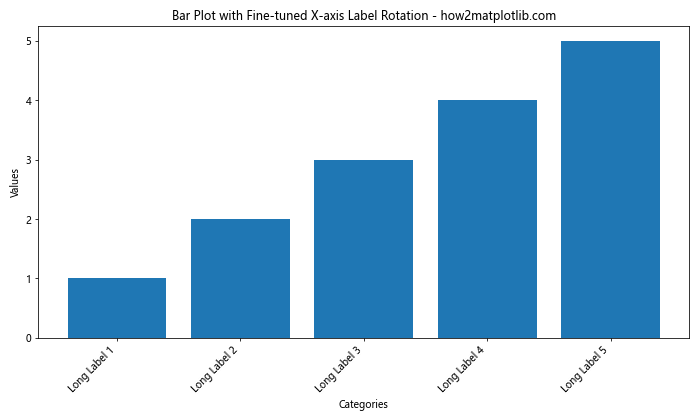
In this example, we use ax.set_xticklabels(x, rotation=45, ha='right') to rotate the labels by 45 degrees and align them to the right. The ha parameter stands for horizontal alignment and can be set to ‘left’, ‘center’, or ‘right’.
Rotating Labels in a Time Series Plot
When working with time series data, rotating date labels is often necessary to prevent overlapping. Here’s an example of how to rotate date labels in a time series plot:
import matplotlib.pyplot as plt
import pandas as pd
import numpy as np

# Create sample time series data
dates = pd.date_range(start='2023-01-01', end='2023-12-31', freq='D')
values = np.cumsum(np.random.randn(len(dates)))

# Create the plot
plt.figure(figsize=(12, 6))
plt.plot(dates, values)

# Rotate and format the date labels
plt.gcf().autofmt_xdate()

# Add labels and title
plt.xlabel('Date')
plt.ylabel('Cumulative Value')
plt.title('Time Series Plot with Rotated Date Labels - how2matplotlib.com')

# Show the plot
plt.tight_layout()
plt.show()
Output:
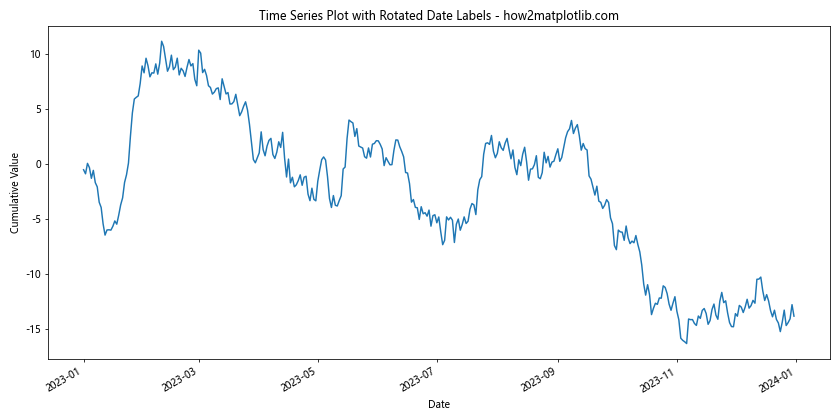
In this example, we use plt.gcf().autofmt_xdate() to automatically format and rotate the date labels. This function is particularly useful for time series plots as it handles the rotation and spacing of date labels elegantly.
Rotating Axis Tick Labels in Seaborn
Seaborn is a statistical data visualization library built on top of Matplotlib. It provides a high-level interface for drawing attractive and informative statistical graphics. While Seaborn uses Matplotlib under the hood, it offers some additional features and syntax for rotating axis tick labels.
Rotating X-axis Labels in Seaborn
To rotate x-axis labels in Seaborn, you can use the set_xticklabels() method on the axis object. Here’s an example:
import seaborn as sns
import matplotlib.pyplot as plt

# Sample data
tips = sns.load_dataset("tips")

# Create the plot
plt.figure(figsize=(10, 6))
ax = sns.barplot(x="day", y="total_bill", data=tips)

# Rotate x-axis labels
ax.set_xticklabels(ax.get_xticklabels(), rotation=45, ha='right')

# Add labels and title
ax.set_xlabel('Day of the Week')
ax.set_ylabel('Total Bill')
ax.set_title('Average Total Bill by Day - how2matplotlib.com')

# Adjust the subplot layout
plt.tight_layout()

# Show the plot
plt.show()
Output:
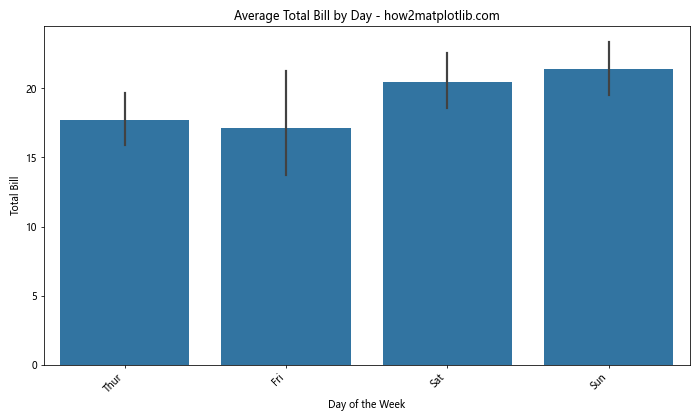
In this example, we create a bar plot using Seaborn’s barplot() function and then rotate the x-axis labels using ax.set_xticklabels(ax.get_xticklabels(), rotation=45, ha='right'). This rotates the labels by 45 degrees and aligns them to the right.
Rotating Y-axis Labels in Seaborn
Rotating y-axis labels in Seaborn follows a similar approach. Here’s an example using a horizontal bar plot:
import seaborn as sns
import matplotlib.pyplot as plt

# Sample data
titanic = sns.load_dataset("titanic")

# Create the plot
plt.figure(figsize=(10, 6))
ax = sns.barplot(x="fare", y="class", data=titanic, orient="h")

# Rotate y-axis labels
ax.set_yticklabels(ax.get_yticklabels(), rotation=0)

# Add labels and title
ax.set_xlabel('Average Fare')
ax.set_ylabel('Passenger Class')
ax.set_title('Average Fare by Passenger Class - how2matplotlib.com')

# Adjust the subplot layout
plt.tight_layout()

# Show the plot
plt.show()
Output:
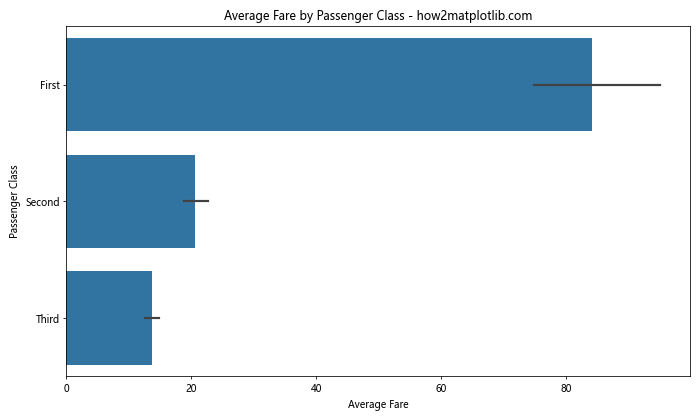
In this case, we use ax.set_yticklabels(ax.get_yticklabels(), rotation=0) to ensure the y-axis labels remain horizontal. You can adjust the rotation angle as needed.
Rotating Labels in Seaborn Categorical Plots
Seaborn’s categorical plots, such as boxplot(), violinplot(), and swarmplot(), often benefit from rotated labels when dealing with many categories. Here’s an example using a box plot:
import seaborn as sns
import matplotlib.pyplot as plt

# Sample data
tips = sns.load_dataset("tips")

# Create the plot
plt.figure(figsize=(12, 6))
ax = sns.boxplot(x="day", y="total_bill", hue="time", data=tips)

# Rotate x-axis labels
ax.set_xticklabels(ax.get_xticklabels(), rotation=45, ha='right')

# Add labels and title
ax.set_xlabel('Day of the Week')
ax.set_ylabel('Total Bill')
ax.set_title('Distribution of Total Bill by Day and Time - how2matplotlib.com')

# Adjust the subplot layout
plt.tight_layout()

# Show the plot
plt.show()
Output:
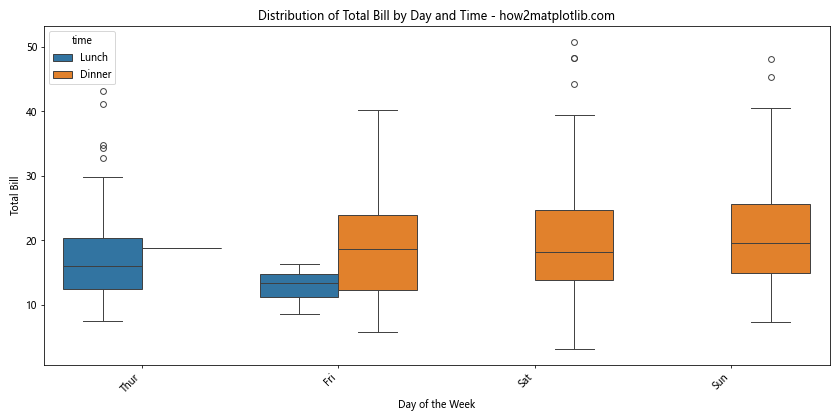
This example creates a box plot with rotated x-axis labels, making it easier to read when dealing with multiple categories and a hue variable.
Rotating Labels in Seaborn FacetGrid
When working with Seaborn’s FacetGrid, you might need to rotate labels across multiple subplots. Here’s how you can achieve this:
import seaborn as sns
import matplotlib.pyplot as plt

# Sample data
tips = sns.load_dataset("tips")

# Create the FacetGrid
g = sns.FacetGrid(tips, col="time", height=5, aspect=1.2)
g.map(sns.barplot, "day", "total_bill")

# Rotate x-axis labels for all subplots
for ax in g.axes.flat:
    ax.set_xticklabels(ax.get_xticklabels(), rotation=45, ha='right')

# Add labels and title
g.set_axis_labels("Day of the Week", "Total Bill")
g.fig.suptitle('Average Total Bill by Day and Time - how2matplotlib.com', y=1.05)

# Adjust the subplot layout
plt.tight_layout()

# Show the plot
plt.show()
Output:
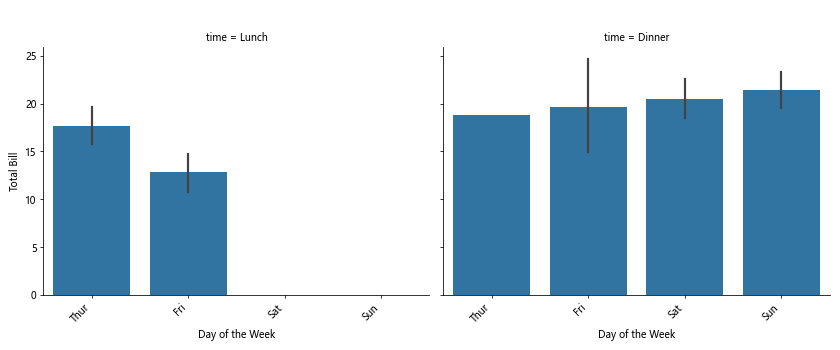
In this example, we create a FacetGrid with bar plots for different time periods. We then iterate through all subplots and rotate their x-axis labels using a for loop.
Advanced Techniques for Rotating Axis Tick Labels
Now that we’ve covered the basics of rotating axis tick labels in both Matplotlib and Seaborn, let’s explore some advanced techniques and considerations.
Adjusting Label Padding
When rotating labels, you might need to adjust the padding to prevent overlap with the plot area. Here’s an example of how to do this:
import matplotlib.pyplot as plt
import numpy as np

# Sample data
categories = ['Category A', 'Category B', 'Category C', 'Category D', 'Category E']
values = np.random.rand(5)

# Create the plot
fig, ax = plt.subplots(figsize=(10, 6))
ax.bar(categories, values)

# Rotate x-axis labels and adjust padding
ax.set_xticklabels(categories, rotation=45, ha='right')
ax.tick_params(axis='x', which='major', pad=15)

# Add labels and title
ax.set_xlabel('Categories')
ax.set_ylabel('Values')
ax.set_title('Bar Plot with Rotated Labels and Adjusted Padding - how2matplotlib.com')

# Adjust the subplot layout
plt.tight_layout()

# Show the plot
plt.show()
Output:
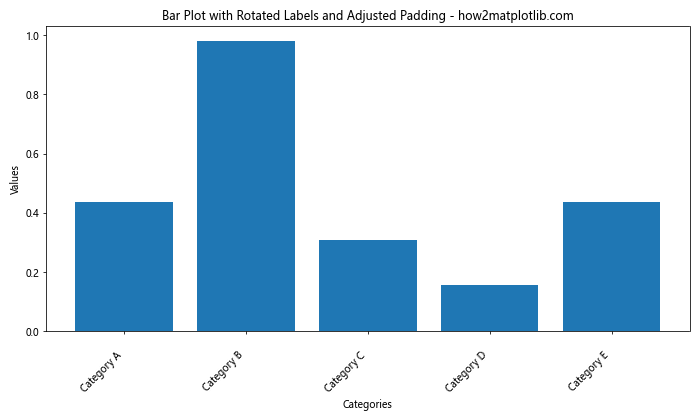
In this example, we use ax.tick_params(axis='x', which='major', pad=15) to increase the padding between the x-axis and its labels, preventing overlap with the plot area.
Using Text Rotation for Individual Labels
Sometimes, you might want to rotate only specific labels or apply different rotations to different labels. Here’s how you can achieve this:
import matplotlib.pyplot as plt
import numpy as np

# Sample data
categories = ['Short', 'Medium Length', 'Very Long Category Name', 'Another Short', 'Last Category']
values = np.random.rand(5)

# Create the plot
fig, ax = plt.subplots(figsize=(12, 6))
ax.bar(categories, values)

# Rotate x-axis labels individually
for i, label in enumerate(ax.get_xticklabels()):
    if len(label.get_text()) > 10:
        label.set_rotation(45)
        label.set_ha('right')
    else:
        label.set_rotation(0)
        label.set_ha('center')

# Add labels and title
ax.set_xlabel('Categories')
ax.set_ylabel('Values')
ax.set_title('Bar Plot with Selectively Rotated Labels - how2matplotlib.com')

# Adjust the subplot layout
plt.tight_layout()

# Show the plot
plt.show()
Output:
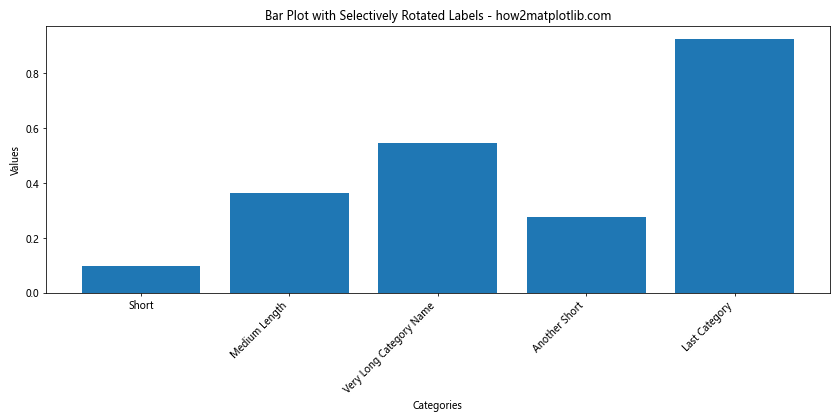
In this example, we iterate through each x-axis label and apply rotation only to labels longer than 10 characters. This approach allows for more flexible label rotation based on specific conditions.
Handling Long Labels with Wrapping
For very long labels, rotation might not be sufficient. In such cases, you can combine rotation with text wrapping:
import matplotlib.pyplot as plt
import numpy as np
import textwrap

# Sample data
categories = ['Short Label', 'Medium Length Label', 'Very Long Category Name That Needs Wrapping', 'Another Short One', 'Last Category With Some Length']
values = np.random.rand(5)

# Create the plot
fig, ax = plt.subplots(figsize=(12, 6))
ax.bar(categories, values)

# Function to wrap and rotate labels
def wrap_labels(ax, width, break_long_words=False):
    labels = []
    for label in ax.get_xticklabels():
        text = label.get_text()
        labels.append(textwrap.fill(text, width=width, break_long_words=break_long_words))
    ax.set_xticklabels(labels, rotation=45, ha='right')

# Apply wrapping and rotation
wrap_labels(ax, 10)

# Add labels and title
ax.set_xlabel('Categories')
ax.set_ylabel('Values')
ax.set_title('Bar Plot with Wrapped and Rotated Labels - how2matplotlib.com')

# Adjust the subplot layout
plt.tight_layout()

# Show the plot
plt.show()
Output:
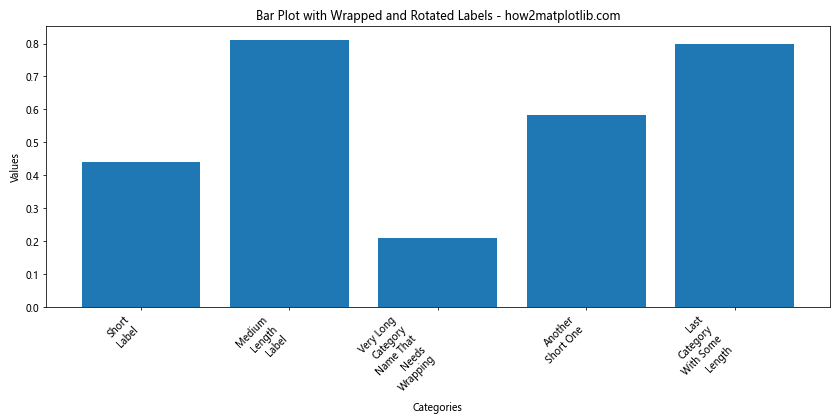
This example defines a wrap_labels() function that wraps long labels to a specified width before rotating them. This approach can be particularly useful when dealing with very long category names.
Rotating Labels in Polar Plots
Rotating labels in polar plots requires a slightly different approach. Here’s an example of how to rotate labels in a polar plot:
import matplotlib.pyplot as plt
import numpy as np

# Sample data
N = 8
theta = np.linspace(0.0, 2 * np.pi, N, endpoint=False)
radii = np.random.rand(N)
width = np.pi / 4 * np.random.rand(N)

# Create the polar plot
fig, ax = plt.subplots(figsize=(10, 10), subplot_kw=dict(projection='polar'))
bars= ax.bar(theta, radii, width=width, bottom=0.0)

# Rotate the labels
ax.set_thetagrids(theta * 180 / np.pi, ['Label ' + str(i+1) for i in range(N)])
for label in ax.get_xticklabels():
    label.set_rotation(label.get_position()[0] * 180 / np.pi - 90)

# Add title
ax.set_title('Polar Plot with Rotated Labels - how2matplotlib.com')

# Show the plot
plt.tight_layout()
plt.show()
Output:
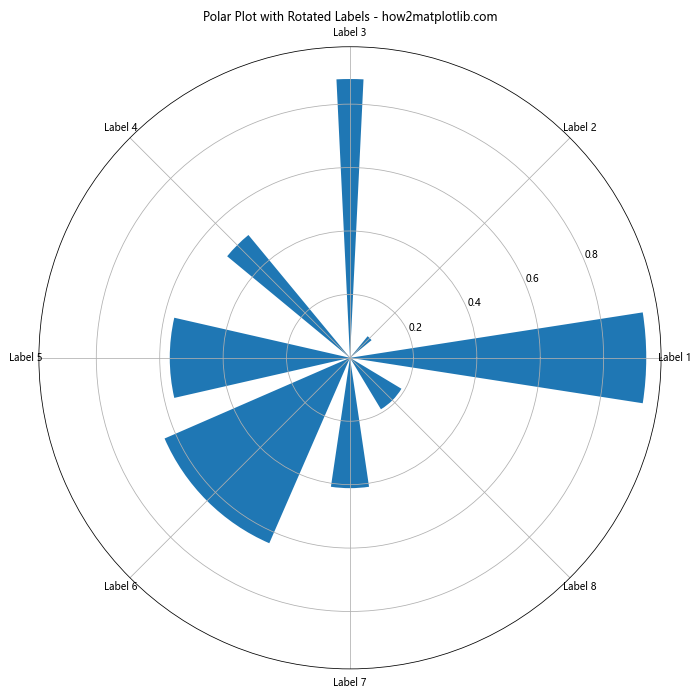
In this example, we create a polar plot and rotate the labels to align with the radial direction. The rotation angle for each label is calculated based on its position in the plot.
Best Practices for Rotating Axis Tick Labels
When rotating axis tick labels in Seaborn and Matplotlib, it’s important to follow some best practices to ensure your visualizations are clear, readable, and professional. Here are some tips to keep in mind:
- Choose the right rotation angle: While 45 degrees is a common choice, the optimal angle depends on your specific data and plot layout. Experiment with different angles to find the best balance between readability and space efficiency.
Align labels properly: When rotating labels, pay attention to their alignment. For x-axis labels, right-alignment (ha=’right’) often works well with rotated text.
Adjust padding and margins: After rotating labels, make sure they don’t overlap with other plot elements. Use
plt.tight_layout()or manually adjust margins and padding as needed.Consider alternative solutions: For very long labels, consider abbreviating, using line breaks, or employing other techniques like tooltips in interactive plots.
Maintain consistency: If you’re creating multiple plots in a single figure or across a project, try to maintain consistent label rotation and styling.
Test readability: Always check your plots at different sizes and on different devices to ensure the rotated labels remain readable.
Let’s implement some of these best practices in an example: