How to Create Stunning Contour Lines with Matplotlib
Matplotlib contour lines are a powerful tool for visualizing three-dimensional data on a two-dimensional plane. This article will explore the various aspects of creating and customizing contour lines using Matplotlib, providing detailed explanations and examples to help you master this essential data visualization technique.
Understanding Matplotlib Contour Lines
Matplotlib contour lines, also known as level lines or isolines, are curves that connect points of equal value in a two-dimensional space. These lines are particularly useful for representing topographical maps, temperature distributions, pressure fields, and other continuous data sets. By using Matplotlib’s contour plotting functions, you can easily create visually appealing and informative contour plots.
Let’s start with a basic example of creating contour lines using Matplotlib:
import numpy as np
import matplotlib.pyplot as plt

# Generate sample data
x = np.linspace(-5, 5, 100)
y = np.linspace(-5, 5, 100)
X, Y = np.meshgrid(x, y)
Z = np.sin(np.sqrt(X**2 + Y**2))

# Create contour plot
plt.figure(figsize=(8, 6))
contour = plt.contour(X, Y, Z)
plt.colorbar(contour)
plt.title("Basic Matplotlib Contour Lines - how2matplotlib.com")
plt.xlabel("X-axis")
plt.ylabel("Y-axis")
plt.show()
Output:
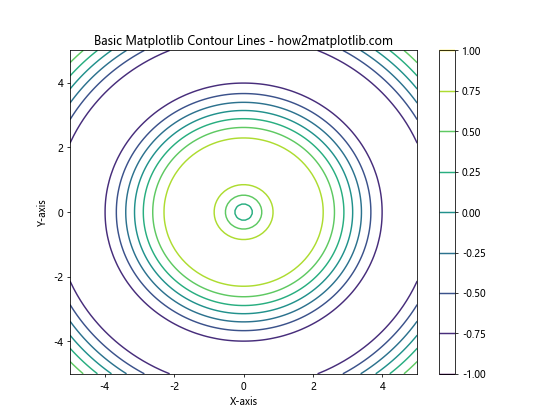
In this example, we generate a sample dataset using NumPy and create a basic contour plot using Matplotlib’s contour function. The colorbar function adds a color scale to help interpret the contour levels.
Customizing Matplotlib Contour Lines
One of the strengths of Matplotlib contour lines is their flexibility in terms of customization. You can adjust various properties of the contour lines to enhance their visual appeal and clarity.
Adjusting Contour Levels
By default, Matplotlib automatically determines the number and values of contour levels. However, you can specify custom levels to better suit your data:
import numpy as np
import matplotlib.pyplot as plt

x = np.linspace(-3, 3, 100)
y = np.linspace(-3, 3, 100)
X, Y = np.meshgrid(x, y)
Z = X**2 + Y**2

plt.figure(figsize=(8, 6))
levels = [0.5, 1, 2, 4, 8]
contour = plt.contour(X, Y, Z, levels=levels)
plt.clabel(contour, inline=True, fontsize=8)
plt.title("Custom Contour Levels - how2matplotlib.com")
plt.xlabel("X-axis")
plt.ylabel("Y-axis")
plt.show()
Output:
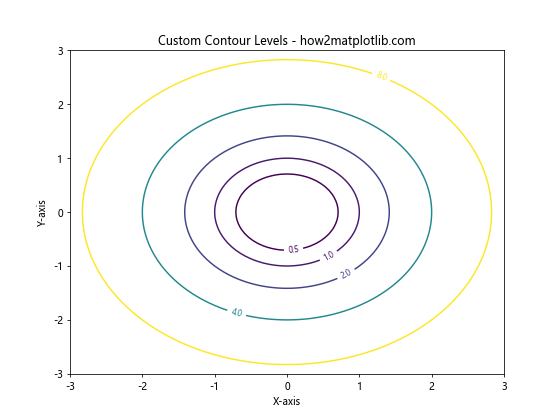
In this example, we specify custom contour levels using the levels parameter. The clabel function adds labels to the contour lines for better readability.
Changing Contour Line Colors
You can customize the colors of Matplotlib contour lines to make them more visually appealing or to match a specific color scheme:
import numpy as np
import matplotlib.pyplot as plt

x = np.linspace(-3, 3, 100)
y = np.linspace(-3, 3, 100)
X, Y = np.meshgrid(x, y)
Z = np.sin(X) * np.cos(Y)

plt.figure(figsize=(8, 6))
colors = ['#1f77b4', '#ff7f0e', '#2ca02c', '#d62728', '#9467bd']
contour = plt.contour(X, Y, Z, colors=colors)
plt.colorbar(contour)
plt.title("Custom Contour Line Colors - how2matplotlib.com")
plt.xlabel("X-axis")
plt.ylabel("Y-axis")
plt.show()
Output:
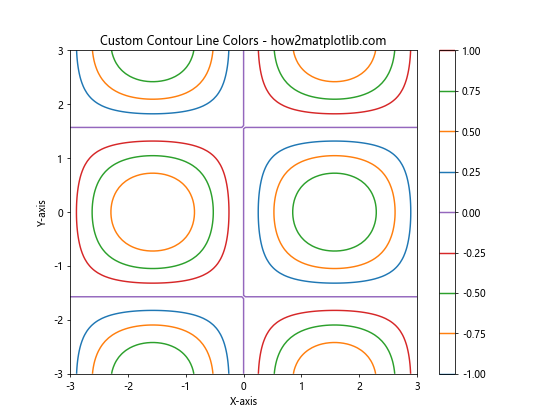
Here, we use a custom color palette for the contour lines by specifying a list of colors in the colors parameter.
Adjusting Line Styles and Widths
Matplotlib contour lines can be further customized by changing their line styles and widths:
import numpy as np
import matplotlib.pyplot as plt

x = np.linspace(-3, 3, 100)
y = np.linspace(-3, 3, 100)
X, Y = np.meshgrid(x, y)
Z = X * np.exp(-X**2 - Y**2)

plt.figure(figsize=(8, 6))
contour = plt.contour(X, Y, Z, linestyles=['solid', 'dashed', 'dotted'],
                      linewidths=[0.5, 1, 1.5, 2])
plt.clabel(contour, inline=True, fontsize=8)
plt.title("Custom Line Styles and Widths - how2matplotlib.com")
plt.xlabel("X-axis")
plt.ylabel("Y-axis")
plt.show()
Output:
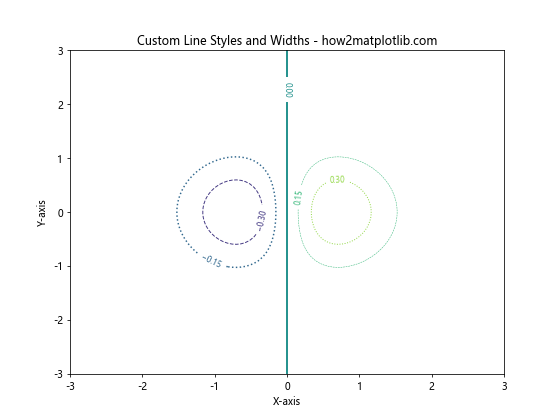
In this example, we use different line styles and widths for the contour lines to create a more visually interesting plot.
Creating Filled Contour Plots
In addition to regular contour lines, Matplotlib also supports filled contour plots, which can be useful for visualizing continuous data distributions:
import numpy as np
import matplotlib.pyplot as plt

x = np.linspace(-3, 3, 100)
y = np.linspace(-3, 3, 100)
X, Y = np.meshgrid(x, y)
Z = np.sin(X) * np.cos(Y)

plt.figure(figsize=(8, 6))
contourf = plt.contourf(X, Y, Z, cmap='viridis')
plt.colorbar(contourf)
plt.title("Filled Contour Plot - how2matplotlib.com")
plt.xlabel("X-axis")
plt.ylabel("Y-axis")
plt.show()
Output:
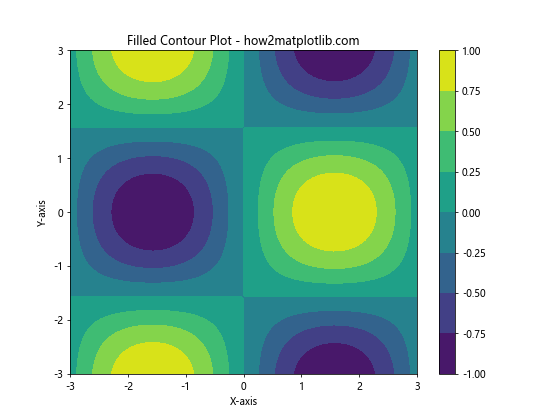
Here, we use the contourf function to create a filled contour plot, which fills the areas between contour lines with colors based on the data values.
Combining Contour Lines and Filled Contours
For a more comprehensive visualization, you can combine regular contour lines with filled contours:
import numpy as np
import matplotlib.pyplot as plt

x = np.linspace(-3, 3, 100)
y = np.linspace(-3, 3, 100)
X, Y = np.meshgrid(x, y)
Z = X * np.exp(-X**2 - Y**2)

plt.figure(figsize=(8, 6))
contourf = plt.contourf(X, Y, Z, cmap='coolwarm')
contour = plt.contour(X, Y, Z, colors='black', linewidths=0.5)
plt.clabel(contour, inline=True, fontsize=8)
plt.colorbar(contourf)
plt.title("Combined Contour Lines and Filled Contours - how2matplotlib.com")
plt.xlabel("X-axis")
plt.ylabel("Y-axis")
plt.show()
Output:
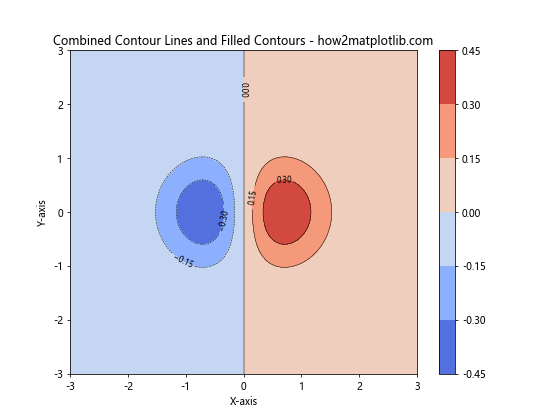
This example demonstrates how to overlay regular contour lines on top of a filled contour plot, providing both a continuous color representation and discrete level lines.
Creating 3D Contour Plots
While Matplotlib contour lines are typically used for 2D visualizations, you can also create 3D contour plots using Matplotlib’s 3D plotting capabilities:
import numpy as np
import matplotlib.pyplot as plt
from mpl_toolkits.mplot3d import Axes3D

x = np.linspace(-3, 3, 100)
y = np.linspace(-3, 3, 100)
X, Y = np.meshgrid(x, y)
Z = np.sin(np.sqrt(X**2 + Y**2))

fig = plt.figure(figsize=(10, 8))
ax = fig.add_subplot(111, projection='3d')
contour = ax.contour(X, Y, Z, cmap='viridis')
ax.set_title("3D Contour Plot - how2matplotlib.com")
ax.set_xlabel("X-axis")
ax.set_ylabel("Y-axis")
ax.set_zlabel("Z-axis")
plt.show()
Output:
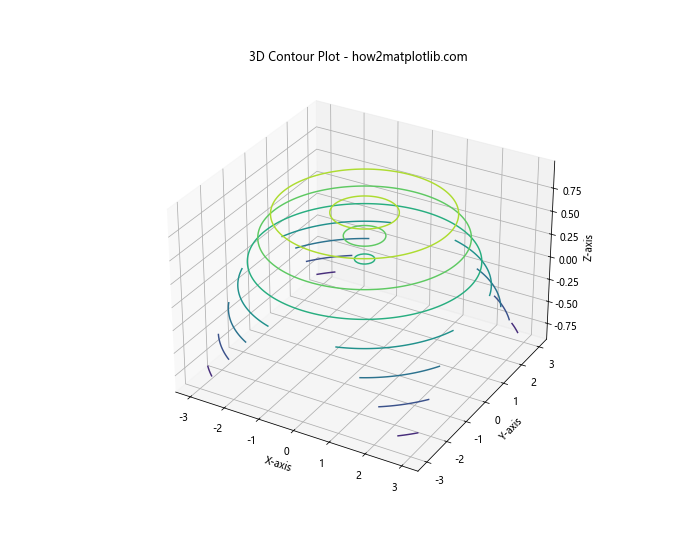
This example creates a 3D contour plot using Matplotlib’s 3D toolkit, allowing you to visualize the contour lines in a three-dimensional space.
Adding Labels and Annotations to Contour Plots
To make your Matplotlib contour lines more informative, you can add labels and annotations to highlight specific features or regions of interest:
import numpy as np
import matplotlib.pyplot as plt

x = np.linspace(-3, 3, 100)
y = np.linspace(-3, 3, 100)
X, Y = np.meshgrid(x, y)
Z = X**2 - Y**2

plt.figure(figsize=(8, 6))
contour = plt.contour(X, Y, Z)
plt.clabel(contour, inline=True, fontsize=8)
plt.title("Labeled Contour Plot - how2matplotlib.com")
plt.xlabel("X-axis")
plt.ylabel("Y-axis")

# Add custom annotation
plt.annotate('Saddle Point', xy=(0, 0), xytext=(1, 1),
             arrowprops=dict(facecolor='black', shrink=0.05))

plt.show()
Output:
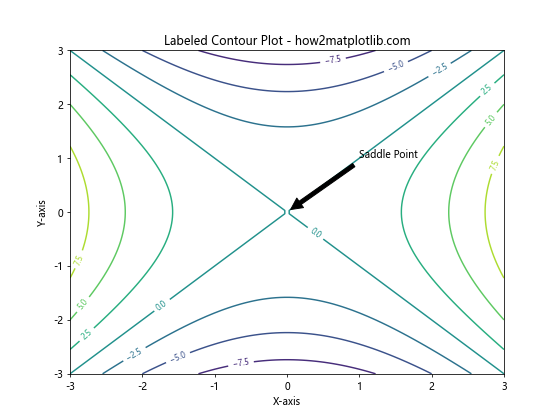
In this example, we add labels to the contour lines using clabel and include a custom annotation to highlight a specific point of interest in the plot.
Creating Contour Plots from Irregular Data
While most examples use regularly gridded data, Matplotlib contour lines can also be created from irregular data points:
import numpy as np
import matplotlib.pyplot as plt
from scipy.interpolate import griddata

# Generate irregular data points
np.random.seed(0)
x = np.random.rand(100) * 4 - 2
y = np.random.rand(100) * 4 - 2
z = x * np.exp(-x**2 - y**2)

# Create a regular grid for interpolation
xi = np.linspace(-2, 2, 100)
yi = np.linspace(-2, 2, 100)
Xi, Yi = np.meshgrid(xi, yi)

# Interpolate the irregular data onto the regular grid
Zi = griddata((x, y), z, (Xi, Yi), method='cubic')

plt.figure(figsize=(8, 6))
contour = plt.contour(Xi, Yi, Zi)
plt.scatter(x, y, c='red', s=5)
plt.colorbar(contour)
plt.title("Contour Plot from Irregular Data - how2matplotlib.com")
plt.xlabel("X-axis")
plt.ylabel("Y-axis")
plt.show()
Output:
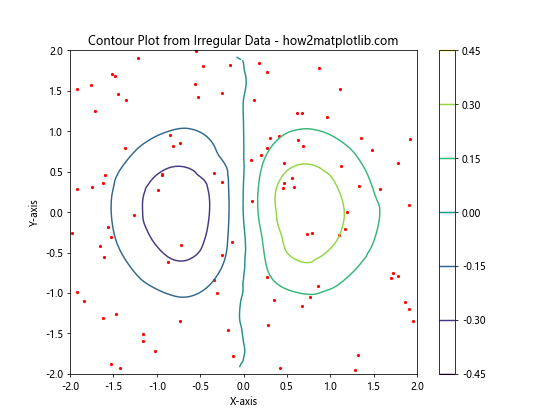
This example demonstrates how to create Matplotlib contour lines from irregularly spaced data points using interpolation.
Creating Contour Plots with Masked Data
Sometimes, you may want to exclude certain regions from your contour plot. Matplotlib contour lines support masked arrays for this purpose:
import numpy as np
import matplotlib.pyplot as plt

x = np.linspace(-3, 3, 100)
y = np.linspace(-3, 3, 100)
X, Y = np.meshgrid(x, y)
Z = np.sin(X) * np.cos(Y)

# Create a mask
mask = np.sqrt(X**2 + Y**2) > 2

# Apply the mask to the data
Z_masked = np.ma.masked_array(Z, mask)

plt.figure(figsize=(8, 6))
contour = plt.contour(X, Y, Z_masked)
plt.colorbar(contour)
plt.title("Contour Plot with Masked Data - how2matplotlib.com")
plt.xlabel("X-axis")
plt.ylabel("Y-axis")
plt.show()
Output:
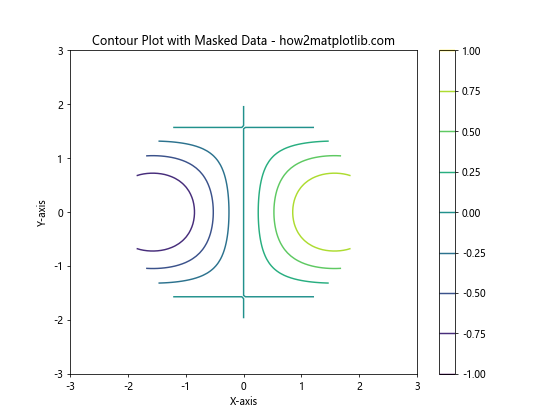
In this example, we create a circular mask to exclude data points outside a certain radius, resulting in a contour plot with a circular cutout.
Creating Contour Plots with Multiple Subplots
For comparing different datasets or visualizing multiple aspects of the same data, you can create Matplotlib contour lines in multiple subplots:
import numpy as np
import matplotlib.pyplot as plt

x = np.linspace(-3, 3, 100)
y = np.linspace(-3, 3, 100)
X, Y = np.meshgrid(x, y)

Z1 = np.sin(X) * np.cos(Y)
Z2 = X**2 - Y**2
Z3 = np.exp(-(X**2 + Y**2))

fig, (ax1, ax2, ax3) = plt.subplots(1, 3, figsize=(15, 5))

contour1 = ax1.contour(X, Y, Z1)
ax1.set_title("Sin(X) * Cos(Y)")
ax1.set_xlabel("X-axis")
ax1.set_ylabel("Y-axis")

contour2 = ax2.contour(X, Y, Z2)
ax2.set_title("X^2 - Y^2")
ax2.set_xlabel("X-axis")
ax2.set_ylabel("Y-axis")

contour3 = ax3.contour(X, Y, Z3)
ax3.set_title("exp(-(X^2 + Y^2))")
ax3.set_xlabel("X-axis")
ax3.set_ylabel("Y-axis")

plt.suptitle("Multiple Contour Plots - how2matplotlib.com")
plt.tight_layout()
plt.show()
Output:
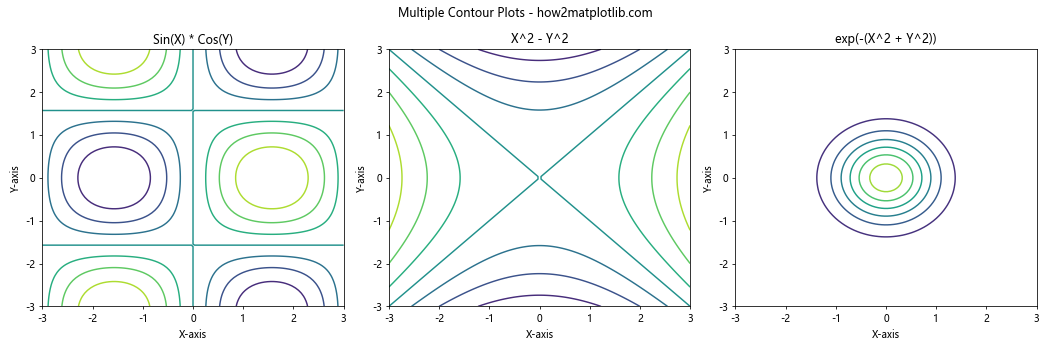
This example creates three different contour plots in separate subplots, allowing for easy comparison of different datasets or functions.
Creating Polar Contour Plots
Matplotlib contour lines can also be used to create polar contour plots, which are useful for visualizing data with circular symmetry:
import numpy as np
import matplotlib.pyplot as plt

r = np.linspace(0, 2, 100)
theta = np.linspace(0, 2*np.pi, 100)
R, Theta = np.meshgrid(r, theta)

Z = R**2 * (1 - R/2) * np.cos(Theta)

plt.figure(figsize=(8, 8))
ax = plt.subplot(111, projection='polar')
contour = ax.contourf(Theta, R, Z, cmap='viridis')
plt.colorbar(contour)
ax.set_title("Polar Contour Plot - how2matplotlib.com")
plt.show()
Output:
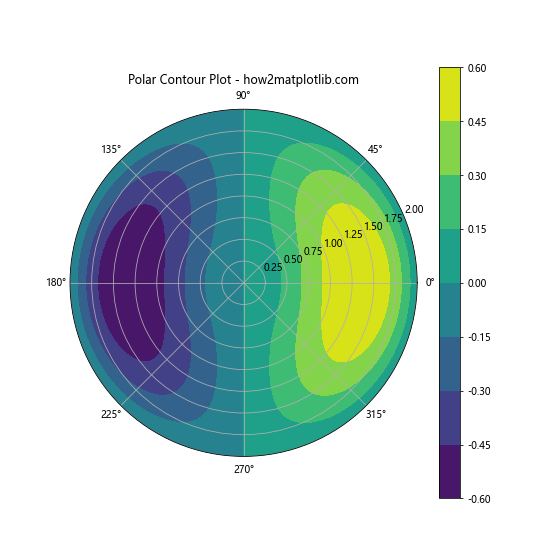
This example demonstrates how to create a polar contour plot using Matplotlib’s polar projection.
Customizing Contour Plot Colormaps
The choice of colormap can significantly impact the visual appeal and interpretability of your Matplotlib contour lines. Here’s an example of how to use different colormaps:
import numpy as np
import matplotlib.pyplot as plt

x = np.linspace(-3, 3, 100)
y = np.linspace(-3, 3, 100)
X, Y = np.meshgrid(x, y)
Z = np.sin(X) * np.cos(Y)

fig, (ax1, ax2) = plt.subplots(1, 2, figsize=(12, 5))

contour1 = ax1.contourf(X, Y, Z, cmap='viridis')
ax1.set_title("Viridis Colormap")
ax1.set_xlabel("X-axis")
ax1.set_ylabel("Y-axis")
plt.colorbar(contour1, ax=ax1)

contour2 = ax2.contourf(X, Y, Z, cmap='coolwarm')
ax2.set_title("Coolwarm Colormap")
ax2.set_xlabel("X-axis")
ax2.set_ylabel("Y-axis")
plt.colorbar(contour2, ax=ax2)

plt.suptitle("Contour Plots with DifferentColormaps - how2matplotlib.com")
plt.tight_layout()
plt.show()
Output:
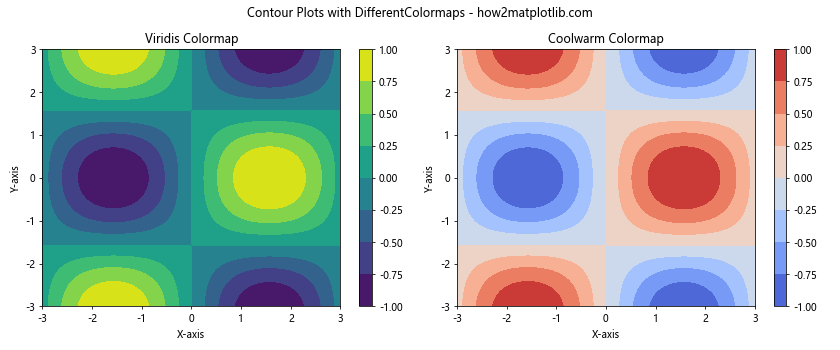
This example compares two different colormaps (viridis and coolwarm) for the same dataset, demonstrating how the choice of colormap can affect the visualization.
Creating Contour Plots with Logarithmic Scales
For data that spans multiple orders of magnitude, using a logarithmic scale for Matplotlib contour lines can be beneficial:
import numpy as np
import matplotlib.pyplot as plt

x = np.logspace(-1, 1, 100)
y = np.logspace(-1, 1, 100)
X, Y = np.meshgrid(x, y)
Z = X**2 * Y

plt.figure(figsize=(8, 6))
contour = plt.contour(X, Y, Z, locator=plt.LogLocator())
plt.colorbar(contour)
plt.xscale('log')
plt.yscale('log')
plt.title("Contour Plot with Logarithmic Scales - how2matplotlib.com")
plt.xlabel("X-axis (log scale)")
plt.ylabel("Y-axis (log scale)")
plt.show()
Output:
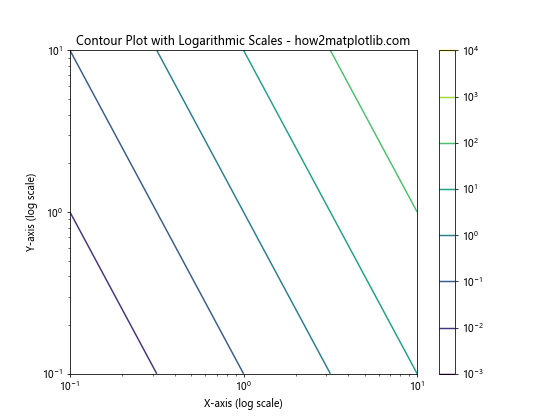
This example creates a contour plot with logarithmic scales on both axes, using plt.LogLocator() to set appropriate contour levels.
Creating Contour Plots with Diverging Color Scales
For data that has a natural center point or zero value, using a diverging color scale can be effective:
import numpy as np
import matplotlib.pyplot as plt

x = np.linspace(-3, 3, 100)
y = np.linspace(-3, 3, 100)
X, Y = np.meshgrid(x, y)
Z = X * Y

plt.figure(figsize=(8, 6))
levels = np.linspace(-9, 9, 19)
contour = plt.contourf(X, Y, Z, levels=levels, cmap='RdBu_r', extend='both')
plt.colorbar(contour)
plt.title("Contour Plot with Diverging Color Scale - how2matplotlib.com")
plt.xlabel("X-axis")
plt.ylabel("Y-axis")
plt.show()
Output:
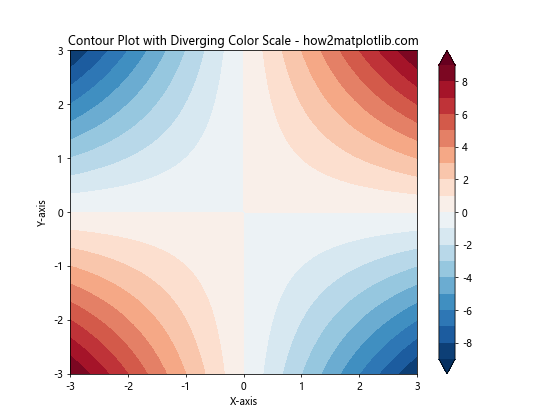
This example uses the ‘RdBu_r’ colormap, which is a reversed red-blue diverging colormap, to highlight positive and negative values symmetrically around zero.
Creating Contour Plots with Hatched Regions
Matplotlib contour lines can be combined with hatching to add texture to different regions of your plot:
import numpy as np
import matplotlib.pyplot as plt

x = np.linspace(-3, 3, 100)
y = np.linspace(-3, 3, 100)
X, Y = np.meshgrid(x, y)
Z = X**2 + Y**2

plt.figure(figsize=(8, 6))
levels = [1, 2, 3, 4, 5]
contour = plt.contourf(X, Y, Z, levels=levels,
                       colors=['#ffcccc', '#ff9999', '#ff6666', '#ff3333', '#ff0000'],
                       hatches=['//', '\\\\', '||', '--', ''])
plt.colorbar(contour)
plt.title("Contour Plot with Hatched Regions - how2matplotlib.com")
plt.xlabel("X-axis")
plt.ylabel("Y-axis")
plt.show()
Output:
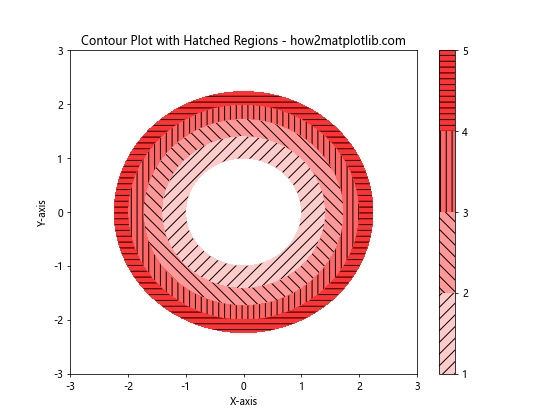
This example demonstrates how to add different hatching patterns to contour regions, providing an additional visual dimension to the plot.
Creating Contour Plots with Custom Normalization
Sometimes, you may want to apply custom normalization to your data before creating Matplotlib contour lines. Here’s an example using logarithmic normalization:
import numpy as np
import matplotlib.pyplot as plt
from matplotlib.colors import LogNorm

x = np.linspace(0, 10, 100)
y = np.linspace(0, 10, 100)
X, Y = np.meshgrid(x, y)
Z = np.exp(X) + Y**2

plt.figure(figsize=(8, 6))
contour = plt.contourf(X, Y, Z, norm=LogNorm(), cmap='viridis')
plt.colorbar(contour)
plt.title("Contour Plot with Logarithmic Normalization - how2matplotlib.com")
plt.xlabel("X-axis")
plt.ylabel("Y-axis")
plt.show()
Output:
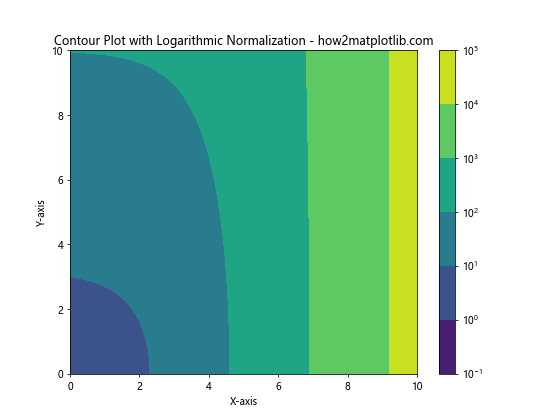
This example uses LogNorm() to apply logarithmic normalization to the data, which can be useful for visualizing data with a large dynamic range.
Conclusion
Matplotlib contour lines are a versatile and powerful tool for visualizing three-dimensional data on a two-dimensional plane. Throughout this comprehensive guide, we’ve explored various aspects of creating and customizing contour plots using Matplotlib. From basic contour plots to more advanced techniques like 3D contours, polar plots, and custom normalizations, Matplotlib provides a wide range of options for creating informative and visually appealing contour visualizations.
By mastering these techniques, you can effectively communicate complex data relationships and patterns in your scientific, engineering, or data analysis projects. Remember to experiment with different color schemes, contour levels, and plot styles to find the most effective way to represent your specific dataset.