Comprehensive Guide to Matplotlib.axis.Axis.get_tightbbox() Function in Python
Matplotlib.axis.Axis.get_tightbbox() function in Python is a powerful tool for optimizing plot layouts in data visualization. This function is an essential part of the Matplotlib library, which is widely used for creating static, animated, and interactive visualizations in Python. The get_tightbbox() function specifically helps in determining the tight bounding box of an axis, which is crucial for creating well-formatted and visually appealing plots. In this comprehensive guide, we’ll explore the Matplotlib.axis.Axis.get_tightbbox() function in depth, covering its usage, parameters, and various applications in data visualization.
Understanding the Basics of Matplotlib.axis.Axis.get_tightbbox()
Matplotlib.axis.Axis.get_tightbbox() function in Python is a method of the Axis class in Matplotlib. It returns the tight bounding box of the axis, including axis labels, tick labels, and axis title. This function is particularly useful when you need to adjust the layout of your plots or when you want to ensure that all elements of your axis are visible without any clipping.
Let’s start with a simple example to demonstrate the basic usage of the Matplotlib.axis.Axis.get_tightbbox() function:
import matplotlib.pyplot as plt
import numpy as np

# Create a simple plot
fig, ax = plt.subplots()
x = np.linspace(0, 10, 100)
ax.plot(x, np.sin(x), label='Sine Wave')
ax.set_title('How2matplotlib.com: Simple Sine Wave')
ax.legend()

# Get the tight bounding box of the axis
bbox = ax.get_tightbbox(fig.canvas.get_renderer())

print(f"Tight bounding box: {bbox}")
plt.show()
Output:
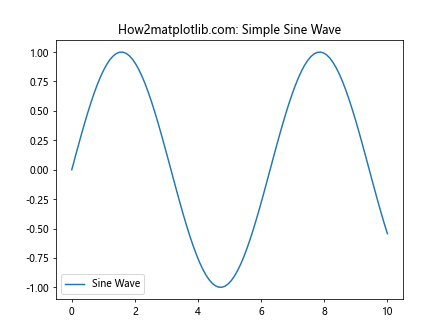
In this example, we create a simple sine wave plot and then use the get_tightbbox() function to obtain the tight bounding box of the axis. The function returns a Bbox object, which contains the coordinates of the bounding box.
Parameters of Matplotlib.axis.Axis.get_tightbbox()
The Matplotlib.axis.Axis.get_tightbbox() function in Python takes one required parameter and several optional parameters. Let’s explore these parameters in detail:
- renderer (required): This is the renderer instance used to calculate the bounding box.
- bbox_extra_artists (optional): A list of additional artists to include in the bounding box calculation.
- for_layout_only (optional): A boolean value that determines whether to include tick labels and axis labels in the bounding box calculation.
Here’s an example demonstrating the use of these parameters:
import matplotlib.pyplot as plt
import numpy as np

fig, ax = plt.subplots()
x = np.linspace(0, 10, 100)
ax.plot(x, np.cos(x), label='Cosine Wave')
ax.set_title('How2matplotlib.com: Cosine Wave with Custom Bounding Box')
ax.legend()

# Create an additional text artist
text = ax.text(5, 0.5, 'How2matplotlib.com', fontsize=12, ha='center')

# Get the tight bounding box including the additional text artist
bbox = ax.get_tightbbox(fig.canvas.get_renderer(), bbox_extra_artists=[text], for_layout_only=False)

print(f"Tight bounding box with extra artist: {bbox}")
plt.show()
Output:
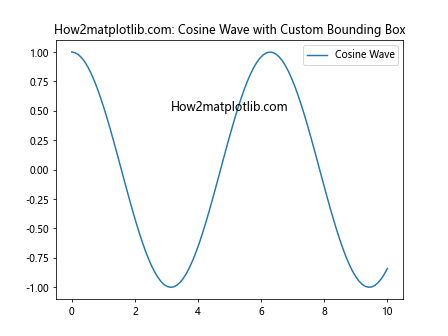
In this example, we include an additional text artist in the bounding box calculation and set for_layout_only to False to include all elements in the calculation.
Practical Applications of Matplotlib.axis.Axis.get_tightbbox()
The Matplotlib.axis.Axis.get_tightbbox() function in Python has several practical applications in data visualization. Let’s explore some of these applications with examples:
1. Adjusting Subplot Layouts
One common use of the get_tightbbox() function is to adjust the layout of subplots to ensure they don’t overlap. Here’s an example:
import matplotlib.pyplot as plt
import numpy as np

fig, (ax1, ax2) = plt.subplots(2, 1, figsize=(8, 10))

# Plot data in both subplots
x = np.linspace(0, 10, 100)
ax1.plot(x, np.sin(x), label='Sine')
ax1.set_title('How2matplotlib.com: Sine Wave')
ax1.legend()

ax2.plot(x, np.cos(x), label='Cosine')
ax2.set_title('How2matplotlib.com: Cosine Wave')
ax2.legend()

# Get tight bounding boxes for both axes
bbox1 = ax1.get_tightbbox(fig.canvas.get_renderer())
bbox2 = ax2.get_tightbbox(fig.canvas.get_renderer())

# Adjust the layout based on the bounding boxes
fig.tight_layout()
plt.subplots_adjust(hspace=bbox1.height + bbox2.height)

plt.show()
Output:
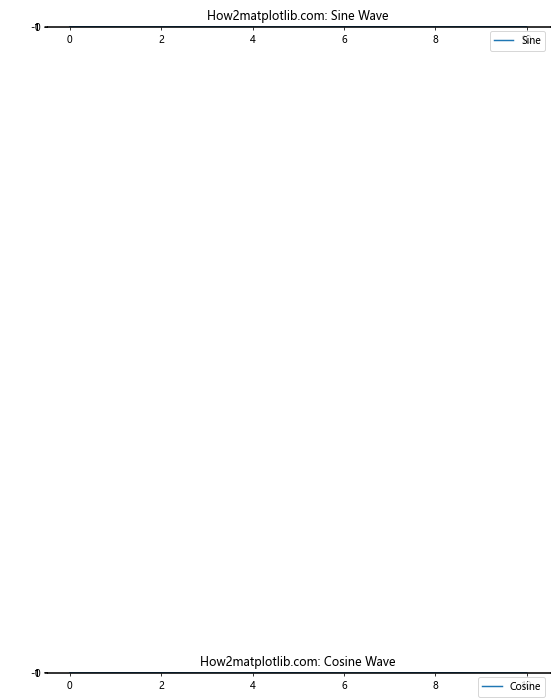
In this example, we use the get_tightbbox() function to calculate the height of each subplot’s bounding box and adjust the vertical spacing accordingly.
2. Creating Custom Annotations
The Matplotlib.axis.Axis.get_tightbbox() function in Python can be useful when creating custom annotations that need to be positioned relative to the axis. Here’s an example:
import matplotlib.pyplot as plt
import numpy as np

fig, ax = plt.subplots()
x = np.linspace(0, 10, 100)
ax.plot(x, np.sin(x), label='Sine Wave')
ax.set_title('How2matplotlib.com: Sine Wave with Custom Annotation')
ax.legend()

# Get the tight bounding box of the axis
bbox = ax.get_tightbbox(fig.canvas.get_renderer())

# Create a custom annotation outside the axis
plt.annotate('How2matplotlib.com', xy=(bbox.x1, bbox.y1), xytext=(10, 10),
             textcoords='offset points', ha='left', va='bottom',
             bbox=dict(boxstyle='round,pad=0.5', fc='yellow', alpha=0.5),
             arrowprops=dict(arrowstyle='->', connectionstyle='arc3,rad=0'))

plt.show()
Output:
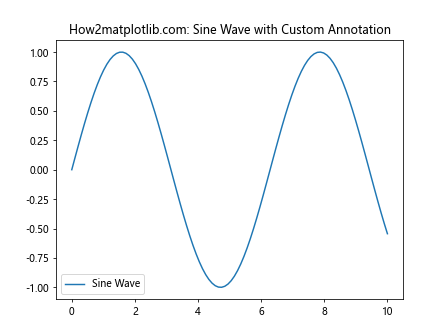
In this example, we use the get_tightbbox() function to determine the position of the axis and place a custom annotation just outside it.
3. Saving Plots with Exact Dimensions
The Matplotlib.axis.Axis.get_tightbbox() function in Python can be used to save plots with exact dimensions, ensuring that no part of the plot is cut off. Here’s an example:
import matplotlib.pyplot as plt
import numpy as np

fig, ax = plt.subplots()
x = np.linspace(0, 10, 100)
ax.plot(x, np.tan(x), label='Tangent')
ax.set_title('How2matplotlib.com: Tangent Function')
ax.legend()

# Get the tight bounding box of the axis
bbox = ax.get_tightbbox(fig.canvas.get_renderer())

# Set the figure size to match the bounding box
fig.set_size_inches(bbox.width / fig.dpi, bbox.height / fig.dpi)

# Save the figure with tight layout
plt.savefig('how2matplotlib_tangent.png', bbox_inches='tight', dpi=300)
plt.show()
Output:
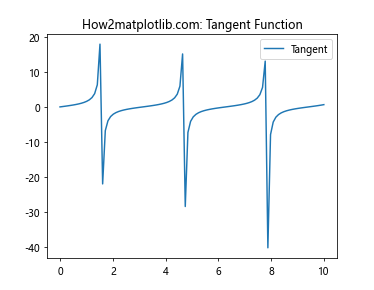
In this example, we use the get_tightbbox() function to determine the exact dimensions of the plot and set the figure size accordingly before saving.
Advanced Usage of Matplotlib.axis.Axis.get_tightbbox()
The Matplotlib.axis.Axis.get_tightbbox() function in Python can be used in more advanced scenarios as well. Let’s explore some of these advanced applications:
1. Creating Custom Layouts
You can use the get_tightbbox() function to create custom layouts that go beyond the standard grid layout. Here’s an example:
import matplotlib.pyplot as plt
import numpy as np

fig = plt.figure(figsize=(12, 8))

# Create main plot
ax_main = fig.add_axes([0.1, 0.1, 0.6, 0.8])
x = np.linspace(0, 10, 100)
ax_main.plot(x, np.sin(x), label='Sine')
ax_main.set_title('How2matplotlib.com: Main Plot')
ax_main.legend()

# Get the tight bounding box of the main axis
bbox_main = ax_main.get_tightbbox(fig.canvas.get_renderer())

# Create secondary plot based on main plot's bounding box
ax_secondary = fig.add_axes([bbox_main.x1 + 0.05, bbox_main.y0, 0.2, bbox_main.height])
ax_secondary.plot(x, np.cos(x), label='Cosine')
ax_secondary.set_title('How2matplotlib.com: Secondary Plot')
ax_secondary.legend()

plt.show()
Output:
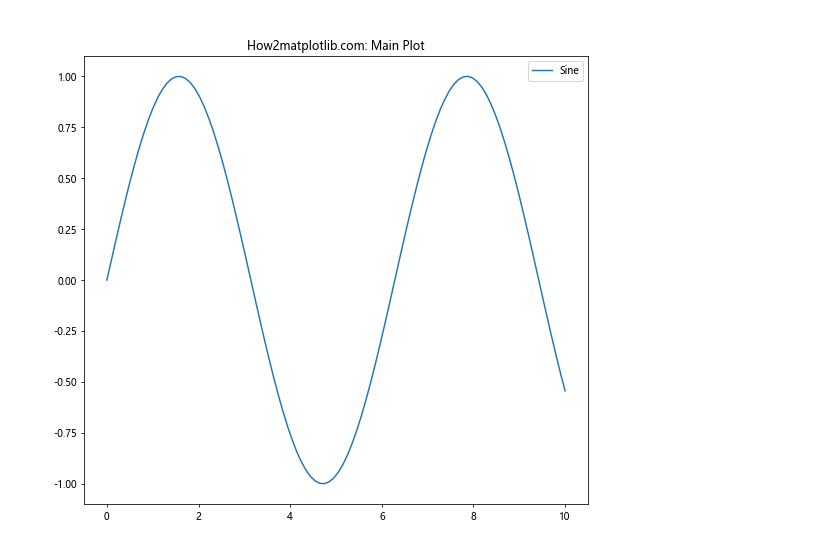
In this example, we use the get_tightbbox() function to position a secondary plot relative to the main plot, creating a custom layout.
2. Dynamic Text Positioning
The Matplotlib.axis.Axis.get_tightbbox() function in Python can be used for dynamic text positioning, ensuring that text doesn’t overlap with other plot elements. Here’s an example:
import matplotlib.pyplot as plt
import numpy as np

fig, ax = plt.subplots()
x = np.linspace(0, 10, 100)
ax.plot(x, np.sin(x), label='Sine')
ax.set_title('How2matplotlib.com: Dynamic Text Positioning')
ax.legend()

# Get the tight bounding box of the axis
bbox = ax.get_tightbbox(fig.canvas.get_renderer())

# Calculate text position
text_x = bbox.x0 + bbox.width * 0.5
text_y = bbox.y1 + 0.05

# Add dynamically positioned text
plt.text(text_x, text_y, 'How2matplotlib.com', ha='center', va='bottom',
         bbox=dict(facecolor='white', edgecolor='black', boxstyle='round,pad=0.5'))

plt.show()
Output:
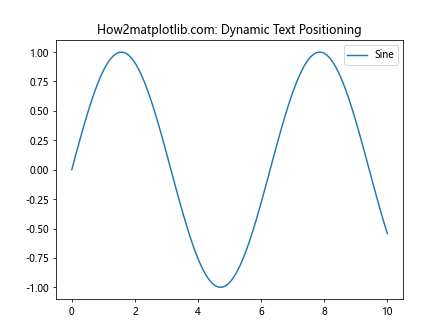
In this example, we use the get_tightbbox() function to calculate a suitable position for additional text above the plot.
3. Creating Inset Axes
The Matplotlib.axis.Axis.get_tightbbox() function in Python can be useful when creating inset axes that need to be positioned relative to the main plot. Here’s an example:
import matplotlib.pyplot as plt
import numpy as np

fig, ax = plt.subplots()
x = np.linspace(0, 10, 100)
ax.plot(x, np.sin(x), label='Sine')
ax.set_title('How2matplotlib.com: Main Plot with Inset')
ax.legend()

# Get the tight bounding box of the main axis
bbox = ax.get_tightbbox(fig.canvas.get_renderer())

# Create inset axes
inset_ax = fig.add_axes([bbox.x0 + bbox.width * 0.6, bbox.y0 + bbox.height * 0.6, bbox.width * 0.3, bbox.height * 0.3])
inset_ax.plot(x, np.cos(x), 'r')
inset_ax.set_title('How2matplotlib.com: Inset', fontsize=8)

plt.show()
Output:
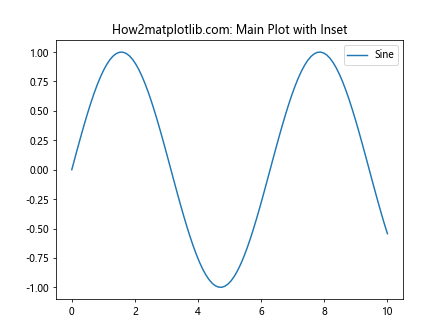
In this example, we use the get_tightbbox() function to position an inset plot within the main plot.
Common Pitfalls and Best Practices
When using the Matplotlib.axis.Axis.get_tightbbox() function in Python, there are some common pitfalls to avoid and best practices to follow:
- Renderer Availability: Always ensure that you have a valid renderer when calling get_tightbbox(). In interactive mode, you might need to call plt.draw() before get_tightbbox() to ensure the renderer is available.
Coordinate Systems: Remember that the bounding box coordinates are in figure coordinates, not data coordinates. Be careful when using these coordinates for data-specific operations.
Performance Considerations: Calculating tight bounding boxes can be computationally expensive. If you’re creating many plots in a loop, consider caching the bounding box results if they don’t change.
Here’s an example demonstrating these best practices: