Comprehensive Guide to Matplotlib.pyplot.margins() Function in Python
Matplotlib.pyplot.margins() function in Python is a powerful tool for adjusting the margins of plots created using Matplotlib. This function allows you to control the amount of padding between the data points and the edges of the plot. Understanding how to use Matplotlib.pyplot.margins() effectively can greatly enhance the visual appeal and readability of your plots. In this comprehensive guide, we’ll explore the various aspects of the Matplotlib.pyplot.margins() function, its parameters, and how to use it in different scenarios.
Introduction to Matplotlib.pyplot.margins()
Matplotlib.pyplot.margins() function in Python is part of the Matplotlib library, which is widely used for creating static, animated, and interactive visualizations in Python. The margins() function specifically deals with setting the padding between the data points and the edges of the plot. This padding is crucial for ensuring that your data points are not cut off at the edges and that there’s enough space around the plot for labels and other annotations.
Let’s start with a basic example to illustrate how Matplotlib.pyplot.margins() works:
import matplotlib.pyplot as plt
import numpy as np

x = np.linspace(0, 10, 100)
y = np.sin(x)

plt.plot(x, y, label='how2matplotlib.com')
plt.margins(0.1)
plt.title('Basic Example of Matplotlib.pyplot.margins()')
plt.legend()
plt.show()
Output:
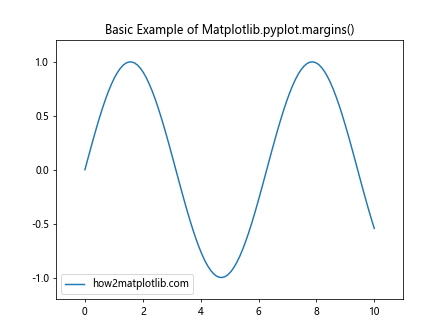
In this example, we’re creating a simple sine wave plot and setting the margins to 0.1 (or 10%) using Matplotlib.pyplot.margins(). This adds a 10% padding around all sides of the plot.
Understanding the Parameters of Matplotlib.pyplot.margins()
The Matplotlib.pyplot.margins() function in Python accepts several parameters that allow you to fine-tune the margins of your plot. Let’s explore these parameters in detail:
- x (float, optional): This parameter sets the padding on the x-axis. It’s expressed as a fraction of the x-axis range.
- y (float, optional): This parameter sets the padding on the y-axis. It’s expressed as a fraction of the y-axis range.
- tight (bool, optional): When set to True, this parameter adjusts the view limits to the data limits. The default is False.
Let’s see an example that demonstrates the use of these parameters:
import matplotlib.pyplot as plt
import numpy as np

x = np.linspace(0, 10, 100)
y = np.cos(x)

plt.plot(x, y, label='how2matplotlib.com')
plt.margins(x=0.2, y=0.3, tight=False)
plt.title('Matplotlib.pyplot.margins() with Different X and Y Margins')
plt.legend()
plt.show()
Output:
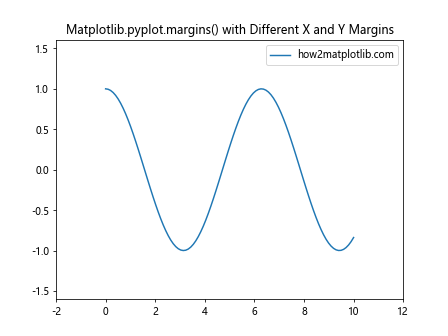
In this example, we’re setting different margins for the x and y axes. The x-axis has a 20% margin, while the y-axis has a 30% margin.
Using Matplotlib.pyplot.margins() with Different Plot Types
Matplotlib.pyplot.margins() function in Python can be used with various types of plots. Let’s explore how to use it with some common plot types:
Line Plots
Line plots are one of the most basic and commonly used plot types. Here’s how you can use Matplotlib.pyplot.margins() with a line plot:
import matplotlib.pyplot as plt
import numpy as np

x = np.linspace(0, 10, 100)
y1 = np.sin(x)
y2 = np.cos(x)

plt.plot(x, y1, label='Sin - how2matplotlib.com')
plt.plot(x, y2, label='Cos - how2matplotlib.com')
plt.margins(0.05)
plt.title('Line Plot with Matplotlib.pyplot.margins()')
plt.legend()
plt.show()
Output:
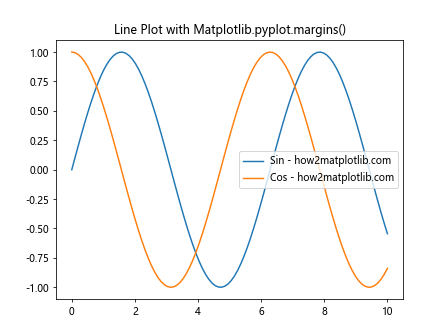
In this example, we’re creating two line plots (sine and cosine) and setting a 5% margin around the plot.
Scatter Plots
Scatter plots are useful for displaying the relationship between two variables. Here’s how to use Matplotlib.pyplot.margins() with a scatter plot:
import matplotlib.pyplot as plt
import numpy as np

x = np.random.rand(50)
y = np.random.rand(50)

plt.scatter(x, y, label='how2matplotlib.com')
plt.margins(0.1)
plt.title('Scatter Plot with Matplotlib.pyplot.margins()')
plt.legend()
plt.show()
Output:
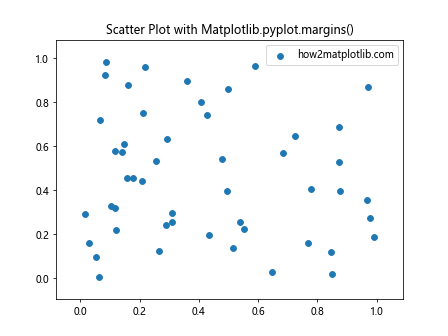
In this scatter plot example, we’re setting a 10% margin around the plot to ensure all points are visible.
Bar Plots
Bar plots are great for comparing quantities across different categories. Let’s see how Matplotlib.pyplot.margins() works with bar plots:
import matplotlib.pyplot as plt
import numpy as np

categories = ['A', 'B', 'C', 'D', 'E']
values = np.random.rand(5)

plt.bar(categories, values)
plt.margins(0.1)
plt.title('Bar Plot with Matplotlib.pyplot.margins()')
plt.xlabel('Categories - how2matplotlib.com')
plt.ylabel('Values')
plt.show()
Output:
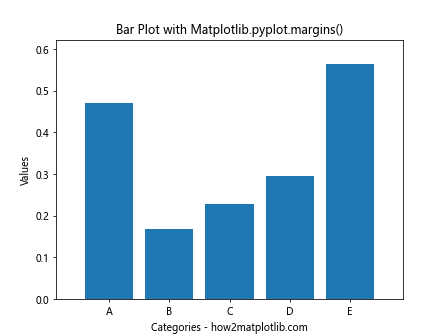
Here, we’re adding a 10% margin around the bar plot to give it some breathing room.
Advanced Usage of Matplotlib.pyplot.margins()
Now that we’ve covered the basics, let’s dive into some more advanced uses of the Matplotlib.pyplot.margins() function in Python.
Asymmetric Margins
You can set different margins for the left, right, top, and bottom of the plot using Matplotlib.pyplot.margins(). Here’s how:
import matplotlib.pyplot as plt
import numpy as np

x = np.linspace(0, 10, 100)
y = np.sin(x)

fig, ax = plt.subplots()
ax.plot(x, y, label='how2matplotlib.com')
ax.margins(x=(0.1, 0.2), y=(0.15, 0.25))
ax.set_title('Asymmetric Margins with Matplotlib.pyplot.margins()')
ax.legend()
plt.show()
In this example, we’re setting different margins for the left (10%) and right (20%) of the x-axis, and for the bottom (15%) and top (25%) of the y-axis.
Using Matplotlib.pyplot.margins() with Subplots
When working with multiple subplots, you can apply margins to each subplot individually:
import matplotlib.pyplot as plt
import numpy as np

x = np.linspace(0, 10, 100)
y1 = np.sin(x)
y2 = np.cos(x)

fig, (ax1, ax2) = plt.subplots(2, 1, figsize=(8, 8))

ax1.plot(x, y1, label='Sin - how2matplotlib.com')
ax1.margins(0.05)
ax1.set_title('Subplot 1 with 5% Margin')
ax1.legend()

ax2.plot(x, y2, label='Cos - how2matplotlib.com')
ax2.margins(0.1)
ax2.set_title('Subplot 2 with 10% Margin')
ax2.legend()

plt.tight_layout()
plt.show()
Output:
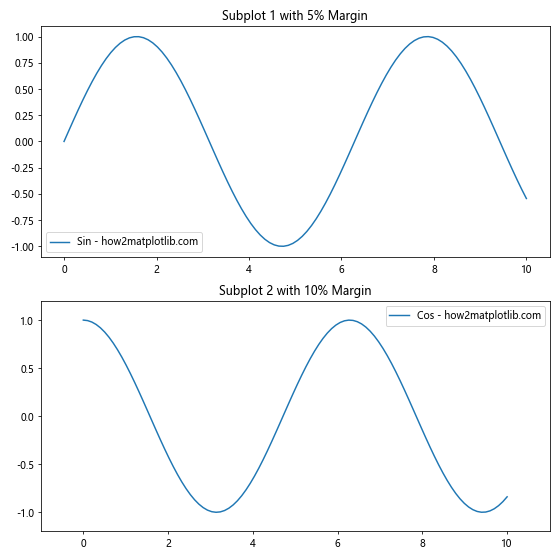
In this example, we’re creating two subplots with different margins: 5% for the first subplot and 10% for the second.
Matplotlib.pyplot.margins() and Axis Scaling
The Matplotlib.pyplot.margins() function in Python interacts interestingly with different axis scaling options. Let’s explore how it works with linear and logarithmic scales.
Linear Scale
On a linear scale, Matplotlib.pyplot.margins() behaves as we’ve seen in previous examples:
import matplotlib.pyplot as plt
import numpy as np

x = np.linspace(1, 10, 100)
y = x**2

plt.plot(x, y, label='how2matplotlib.com')
plt.margins(0.1)
plt.title('Matplotlib.pyplot.margins() with Linear Scale')
plt.xlabel('X')
plt.ylabel('Y')
plt.legend()
plt.show()
Output:
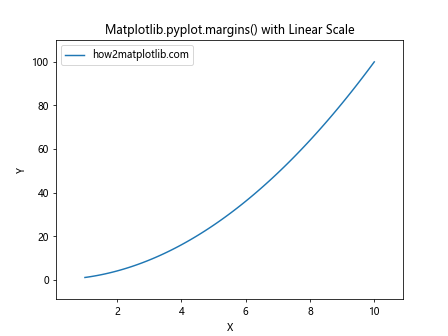
Here, we’re plotting a quadratic function with a 10% margin on both axes.
Logarithmic Scale
On a logarithmic scale, Matplotlib.pyplot.margins() behaves slightly differently:
import matplotlib.pyplot as plt
import numpy as np

x = np.logspace(0, 2, 100)
y = x**2

plt.plot(x, y, label='how2matplotlib.com')
plt.xscale('log')
plt.yscale('log')
plt.margins(0.1)
plt.title('Matplotlib.pyplot.margins() with Logarithmic Scale')
plt.xlabel('X (log scale)')
plt.ylabel('Y (log scale)')
plt.legend()
plt.show()
Output:
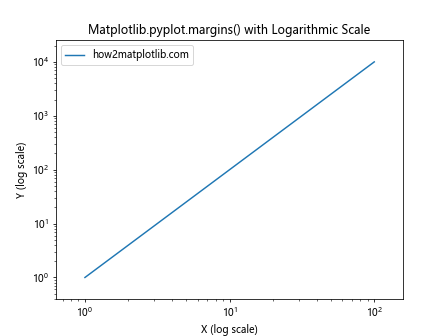
In this example, we’re using a logarithmic scale for both axes. The margins are applied in log space, which can result in visually different padding compared to linear scales.
Matplotlib.pyplot.margins() and Data Limits
The Matplotlib.pyplot.margins() function in Python can be used in conjunction with other functions that control the plot limits, such as xlim() and ylim(). Let’s see how these interact:
import matplotlib.pyplot as plt
import numpy as np

x = np.linspace(0, 10, 100)
y = np.sin(x)

plt.plot(x, y, label='how2matplotlib.com')
plt.margins(0.1)
plt.xlim(2, 8)
plt.ylim(-0.8, 0.8)
plt.title('Matplotlib.pyplot.margins() with Explicit Limits')
plt.xlabel('X')
plt.ylabel('Y')
plt.legend()
plt.show()
Output:
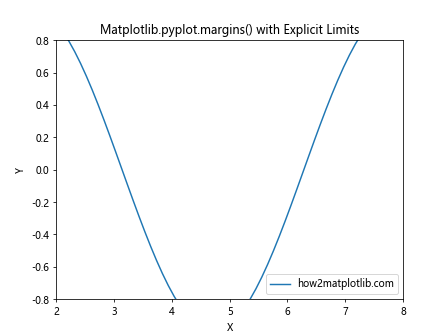
In this example, we’re setting explicit limits on both axes using xlim() and ylim(), and then applying a 10% margin. The margin is applied within the specified limits.
Matplotlib.pyplot.margins() in 3D Plots
The Matplotlib.pyplot.margins() function in Python can also be used with 3D plots, although its behavior is slightly different. In 3D plots, margins() affects the scaling of the plot rather than adding padding. Let’s see an example:
import matplotlib.pyplot as plt
import numpy as np
from mpl_toolkits.mplot3d import Axes3D

fig = plt.figure()
ax = fig.add_subplot(111, projection='3d')

x = np.linspace(-5, 5, 100)
y = np.linspace(-5, 5, 100)
X, Y = np.meshgrid(x, y)
Z = np.sin(np.sqrt(X**2 + Y**2))

ax.plot_surface(X, Y, Z)
ax.margins(0.1)
ax.set_title('3D Plot with Matplotlib.pyplot.margins()')
ax.set_xlabel('X - how2matplotlib.com')
ax.set_ylabel('Y - how2matplotlib.com')
ax.set_zlabel('Z - how2matplotlib.com')

plt.show()
Output:
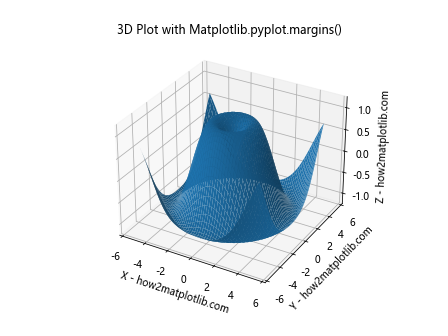
In this 3D plot example, the margins() function affects the overall scaling of the plot, making it appear slightly zoomed out.
Matplotlib.pyplot.margins() and Aspect Ratio
The Matplotlib.pyplot.margins() function in Python can interact interestingly with the aspect ratio of the plot. Let’s explore this interaction:
import matplotlib.pyplot as plt
import numpy as np

x = np.linspace(0, 10, 100)
y = np.sin(x)

fig, (ax1, ax2) = plt.subplots(1, 2, figsize=(12, 5))

ax1.plot(x, y, label='how2matplotlib.com')
ax1.margins(0.1)
ax1.set_aspect('equal')
ax1.set_title('Equal Aspect Ratio')
ax1.legend()

ax2.plot(x, y, label='how2matplotlib.com')
ax2.margins(0.1)
ax2.set_aspect('auto')
ax2.set_title('Auto Aspect Ratio')
ax2.legend()

plt.tight_layout()
plt.show()
Output:
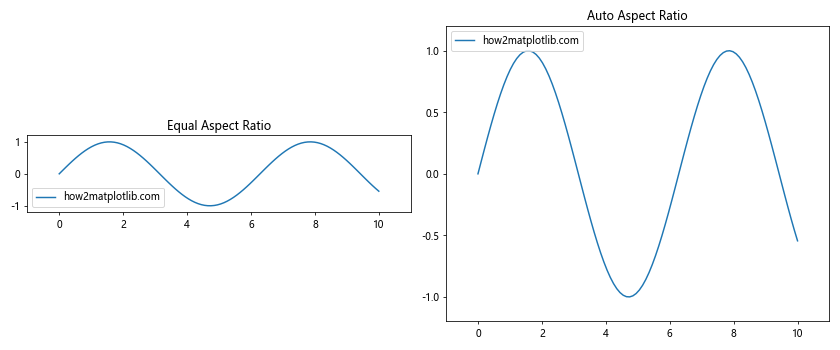
In this example, we’re creating two subplots: one with an equal aspect ratio and one with an automatic aspect ratio. The margins are applied differently in each case.
Matplotlib.pyplot.margins() and Polar Plots
The Matplotlib.pyplot.margins() function in Python can also be used with polar plots. Here’s an example:
import matplotlib.pyplot as plt
import numpy as np

theta = np.linspace(0, 2*np.pi, 100)
r = np.cos(4*theta)

fig, ax = plt.subplots(subplot_kw=dict(projection='polar'))
ax.plot(theta, r)
ax.margins(0.1)
ax.set_title('Polar Plot with Matplotlib.pyplot.margins()')
ax.text(0, 0, 'how2matplotlib.com', ha='center', va='center')

plt.show()
Output:
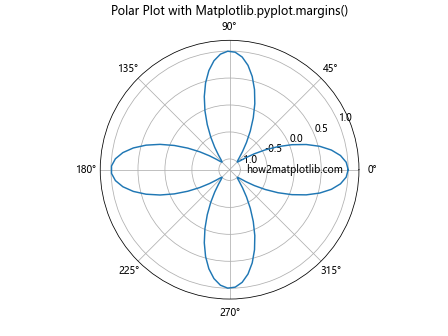
In this polar plot example, the margins() function affects the radial extent of the plot.
Matplotlib.pyplot.margins() and Animations
The Matplotlib.pyplot.margins() function in Python can be used in animations to dynamically adjust the plot margins. Here’s a simple example:
import matplotlib.pyplot as plt
import numpy as np
from matplotlib.animation import FuncAnimation

fig, ax = plt.subplots()
x = np.linspace(0, 10, 100)
line, = ax.plot(x, np.sin(x))
ax.set_title('Animated Margins with Matplotlib.pyplot.margins()')
ax.text(5, 0, 'how2matplotlib.com', ha='center', va='center')

def animate(i):
    line.set_ydata(np.sin(x + i/10))
    ax.margins(0.1 + i/100)
    return line,

ani = FuncAnimation(fig, animate, frames=100, interval=50, blit=True)
plt.show()
Output:
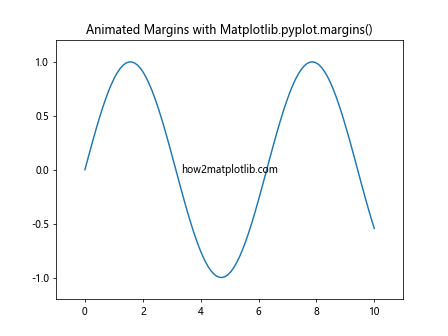
In this animation, we’re gradually increasing the margins as the sine wave shifts.
Best Practices for Using Matplotlib.pyplot.margins()
When using the Matplotlib.pyplot.margins() function in Python, there are several best practices to keep in mind:
- Use small values: Generally, margin values between 0 and 0.2 (0% to 20%) work well for most plots.
Consider the data range: If your data has a wide range, you might need smaller margins to avoid excessive white space.
Be consistent: If you’re creating multiple plots for comparison, try to use consistent margins across all plots.
Combine with other layout tools: Use margins() in conjunction with tight_layout() or constrained_layout for optimal plot layout.
Adjust for annotations: If you’re adding annotations or text to your plot, you might need to increase the margins to accommodate them.
Here’s an example demonstrating these best practices: