Comprehensive Guide to Using Matplotlib.artist.Artist.set_url() in Python for Data Visualization
Matplotlib.artist.Artist.set_url() in Python is a powerful method that allows you to add interactivity to your plots by setting a URL for an artist object. This function is part of the Matplotlib library, which is widely used for creating static, animated, and interactive visualizations in Python. In this comprehensive guide, we’ll explore the various aspects of Matplotlib.artist.Artist.set_url() and how it can enhance your data visualization projects.
Understanding Matplotlib.artist.Artist.set_url() in Python
Matplotlib.artist.Artist.set_url() is a method that belongs to the Artist class in Matplotlib. The Artist class is the base class for all drawable objects in Matplotlib, including lines, text, and patches. The set_url() method allows you to associate a URL with an artist object, which can be useful for creating interactive plots or adding metadata to your visualizations.
Let’s start with a simple example to demonstrate how to use Matplotlib.artist.Artist.set_url():
import matplotlib.pyplot as plt
fig, ax = plt.subplots()
circle = plt.Circle((0.5, 0.5), 0.2, color='blue')
circle.set_url('https://how2matplotlib.com')
ax.add_artist(circle)
plt.show()
Output:
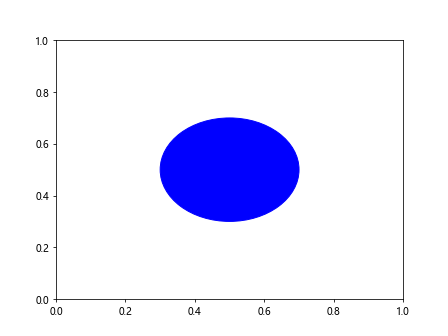
In this example, we create a circle using plt.Circle() and then use the set_url() method to associate a URL with the circle. When you hover over the circle in an interactive environment, you’ll be able to see the URL.
Advanced Techniques for Using Matplotlib.artist.Artist.set_url() in Python
Matplotlib.artist.Artist.set_url() can be used in more advanced ways to create complex, interactive visualizations. Let’s explore some advanced techniques:
Creating Clickable Legends with Matplotlib.artist.Artist.set_url()
You can use set_url() to make legend entries clickable, providing additional information about each data series:
import matplotlib.pyplot as plt
import numpy as np
x = np.linspace(0, 10, 100)
y1 = np.sin(x)
y2 = np.cos(x)
fig, ax = plt.subplots()
line1, = ax.plot(x, y1, label='Sine')
line2, = ax.plot(x, y2, label='Cosine')
line1.set_url('https://how2matplotlib.com/sine')
line2.set_url('https://how2matplotlib.com/cosine')
legend = ax.legend()
for text in legend.get_texts():
text.set_url(f'https://how2matplotlib.com/{text.get_text().lower()}')
plt.title('Clickable Legend Example')
plt.show()
Output:
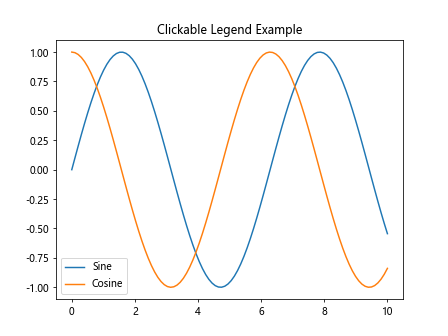
In this example, we associate URLs with both the plotted lines and the legend entries, making the entire plot more interactive.
Using Matplotlib.artist.Artist.set_url() with Annotations
You can combine set_url() with annotations to create informative tooltips:
import matplotlib.pyplot as plt
import numpy as np
fig, ax = plt.subplots()
x = np.linspace(0, 10, 100)
y = np.sin(x)
line, = ax.plot(x, y)
annotation = ax.annotate('Peak', xy=(np.pi/2, 1), xytext=(3, 1.5),
arrowprops=dict(facecolor='black', shrink=0.05))
annotation.set_url('https://how2matplotlib.com/sine_peak')
plt.title('Annotation with URL')
plt.show()
Output:
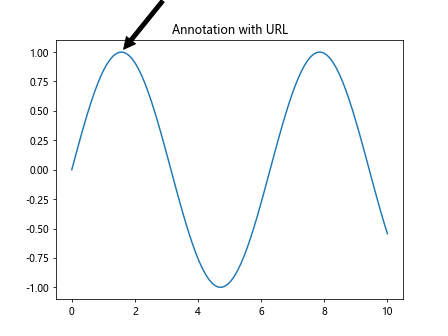
This example creates an annotation for the peak of the sine wave and associates a URL with it, providing additional context for the annotated feature.
Best Practices for Using Matplotlib.artist.Artist.set_url() in Python
When working with Matplotlib.artist.Artist.set_url(), it’s important to follow some best practices to ensure your visualizations are effective and user-friendly:
- Use meaningful URLs: Ensure that the URLs you set provide relevant and useful information related to the plot element.
-
Maintain consistency: If you’re using set_url() across multiple elements in your plot, maintain a consistent structure for your URLs.
-
Consider accessibility: Remember that not all users may be able to interact with your plot in the same way. Provide alternative means of accessing the information when possible.
-
Test in different environments: The behavior of set_url() may vary depending on the environment in which your plot is displayed. Test your visualizations in different contexts to ensure they work as expected.
Here’s an example that demonstrates these best practices:
import matplotlib.pyplot as plt
import numpy as np
def create_url(category, subcategory):
return f'https://how2matplotlib.com/{category}/{subcategory}'
categories = ['fruits', 'vegetables', 'grains']
values = [25, 30, 45]
colors = ['red', 'green', 'yellow']
fig, ax = plt.subplots()
wedges, texts, autotexts = ax.pie(values, labels=categories, colors=colors, autopct='%1.1f%%')
for wedge, category in zip(wedges, categories):
wedge.set_url(create_url('food', category))
plt.title('Food Distribution')
plt.show()
Output:
This example creates a pie chart with clickable wedges, using a consistent URL structure and meaningful categories.
Common Challenges and Solutions When Using Matplotlib.artist.Artist.set_url() in Python
While Matplotlib.artist.Artist.set_url() is a powerful tool, you may encounter some challenges when using it. Here are some common issues and their solutions:
Challenge 1: URLs Not Working in Static Images
Solution: Remember that set_url() is primarily useful in interactive environments. For static images, consider adding a legend or annotations with the relevant information.
import matplotlib.pyplot as plt
import numpy as np
x = np.linspace(0, 10, 100)
y = np.sin(x)
fig, ax = plt.subplots()
line, = ax.plot(x, y)
line.set_url('https://how2matplotlib.com/sine')
ax.text(5, 0.5, 'URL: https://how2matplotlib.com/sine', fontsize=8, ha='center')
plt.title('Static Image with URL Information')
plt.show()
Output:
This example adds the URL information as text directly on the plot, making it visible even in static images.
Challenge 2: Too Many URLs Making the Plot Cluttered
Solution: Use set_url() selectively on key elements, or implement a hover-based system for displaying URLs.
import matplotlib.pyplot as plt
import numpy as np
x = np.linspace(0, 10, 100)
y1 = np.sin(x)
y2 = np.cos(x)
fig, ax = plt.subplots()
line1, = ax.plot(x, y1, label='Sine')
line2, = ax.plot(x, y2, label='Cosine')
line1.set_url('https://how2matplotlib.com/sine')
line2.set_url('https://how2matplotlib.com/cosine')
ax.legend()
plt.title('Selective URL Usage')
plt.show()
Output:
In this example, we only set URLs for the main plot lines, avoiding clutter while still providing interactivity.
Integrating Matplotlib.artist.Artist.set_url() with Other Matplotlib Features
Matplotlib.artist.Artist.set_url() can be effectively combined with other Matplotlib features to create more complex and informative visualizations. Let’s explore some of these integrations:
Combining set_url() with Subplots
You can use set_url() in conjunction with subplots to create multi-panel figures with interactive elements:
import matplotlib.pyplot as plt
import numpy as np
fig, (ax1, ax2) = plt.subplots(1, 2, figsize=(12, 5))
x = np.linspace(0, 10, 100)
y1 = np.sin(x)
y2 = np.cos(x)
line1, = ax1.plot(x, y1)
line1.set_url('https://how2matplotlib.com/sine')
ax1.set_title('Sine Wave')
line2, = ax2.plot(x, y2)
line2.set_url('https://how2matplotlib.com/cosine')
ax2.set_title('Cosine Wave')
plt.tight_layout()
plt.show()
Output:
This example creates a figure with two subplots, each with its own interactive element.
Advanced Applications of Matplotlib.artist.Artist.set_url() in Data Analysis
Matplotlib.artist.Artist.set_url() can be particularly useful in data analysis scenarios, allowing you to create interactive visualizations that provide deeper insights into your data. Here are some advanced applications:
Creating Interactive Heatmaps
You can use set_url() to make each cell in a heatmap clickable, providing detailed information about specific data points:
import matplotlib.pyplot as plt
import numpy as np
data = np.random.rand(10, 10)
fig, ax = plt.subplots()
heatmap = ax.imshow(data, cmap='viridis')
for i in range(10):
for j in range(10):
text = ax.text(j, i, f'{data[i, j]:.2f}', ha='center', va='center', color='w')
text.set_url(f'https://how2matplotlib.com/heatmap/{i}/{j}')
plt.colorbar(heatmap)
plt.title('Interactive Heatmap')
plt.show()
Output:
This example creates a heatmap where each cell is associated with a unique URL, allowing users to access detailed information about specific data points.
Interactive Time Series Analysis
You can use set_url() to create interactive time series plots that allow users to access detailed information about specific time points:
import matplotlib.pyplot as plt
import numpy as np
import pandas as pd
dates = pd.date_range(start='2023-01-01', end='2023-12-31', freq='D')
values = np.cumsum(np.random.randn(len(dates)))
fig, ax = plt.subplots(figsize=(12, 6))
line, = ax.plot(dates, values)
for i, (date, value) in enumerate(zip(dates, values)):
point, = ax.plot(date, value, 'ro', markersize=5)
point.set_url(f'https://how2matplotlib.com/timeseries/{date.strftime("%Y-%m-%d")}')
plt.title('Interactive Time Series')
plt.xlabel('Date')
plt.ylabel('Value')
plt.show()
Output:
This example creates a time series plot where each data point is clickable, allowing users to access detailed information about specific dates.
Optimizing Performance When Using Matplotlib.artist.Artist.set_url() in Python
When working with large datasets or complex visualizations, it’s important to optimize the performance of your Matplotlib plots that use set_url(). Here are some tips to improve performance:
- Limit the number of interactive elements: Instead of setting a URL for every data point, consider using set_url() only for key elements or aggregated data.
-
Use efficient data structures: When working with large datasets, use efficient data structures like NumPy arrays or Pandas DataFrames to manage your data.
-
Implement lazy loading: For very large datasets, consider implementing a lazy loading mechanism where URLs are set only for visible elements.
Here’s an example that demonstrates these optimization techniques:
import matplotlib.pyplot as plt
import numpy as np
import pandas as pd
# Generate a large dataset
dates = pd.date_range(start='2020-01-01', end='2023-12-31', freq='D')
values = np.cumsum(np.random.randn(len(dates)))
# Create a DataFrame for efficient data management
df = pd.DataFrame({'date': dates, 'value': values})
# Aggregate data by month for better performance
monthly_data = df.resample('M', on='date').mean()
fig, ax = plt.subplots(figsize=(12, 6))
line, = ax.plot(monthly_data.index, monthly_data.value)
# Set URL only for month-end points
for date, value in monthly_data.iterrows():
point, = ax.plot(date, value, 'ro', markersize=5)
point.set_url(f'https://how2matplotlib.com/monthly/{date.strftime("%Y-%m")}')
plt.title('Optimized Interactive Time Series')
plt.xlabel('Date')
plt.ylabel('Value')
plt.show()
Output:
This example aggregates daily data into monthly data, reducing the number of interactive elements while still providing useful information.
Troubleshooting Common Issues with Matplotlib.artist.Artist.set_url() in Python
When working with Matplotlib.artist.Artist.set_url(), you may encounter some common issues. Here are some troubleshooting tips:
Issue 1: URLs Not Appearing in Output
If you’re not seeing the URLs in your output, make sure you’re using an interactive backend that supports URL functionality. You can set this using:
import matplotlib
matplotlib.use('TkAgg') # or another interactive backend
import matplotlib.pyplot as plt
import numpy as np
x = np.linspace(0, 10, 100)
y = np.sin(x)
fig, ax = plt.subplots()
line, = ax.plot(x, y)
line.set_url('https://how2matplotlib.com/sine')
plt.title('Troubleshooting URL Visibility')
plt.show()
Output:
Extending Matplotlib.artist.Artist.set_url() Functionality
While Matplotlib.artist.Artist.set_url() provides basic URL functionality, you can extend its capabilities to create more advanced interactive visualizations. Here are some ways to extend its functionality:
Custom URL Handlers
You can create custom URL handlers to perform specific actions when a URL is clicked:
import matplotlib.pyplot as plt
import numpy as np
import webbrowser
def custom_url_handler(url):
print(f"Custom handler: {url}")
webbrowser.open(url)
x = np.linspace(0, 10, 100)
y = np.sin(x)
fig, ax = plt.subplots()
line, = ax.plot(x, y)
line.set_url('https://how2matplotlib.com/custom_handler')
fig.canvas.mpl_connect('button_press_event', lambda event: custom_url_handler(line.get_url()))
plt.title('Custom URL Handler')
plt.show()
Output:
This example defines a custom URL handler that prints the URL and opens it in a web browser when the plot is clicked.
Best Practices for Documentation and Sharing
When using Matplotlib.artist.Artist.set_url() in your projects, it’s important to document your code properly and share your visualizations effectively. Here are some best practices:
- Include clear comments explaining the purpose of each set_url() call.
- Provide a legend or key explaining what different URLs represent.
- When sharing static versions of your plots, include a text description of the interactive elements.
- Consider creating a companion webpage that explains the interactive features of your visualization.
Here’s an example that demonstrates good documentation practices:
import matplotlib.pyplot as plt
import numpy as np
# Generate data
x = np.linspace(0, 10, 100)
y1 = np.sin(x)
y2 = np.cos(x)
fig, ax = plt.subplots()
# Plot sine wave and set URL
line1, = ax.plot(x, y1, label='Sine')
line1.set_url('https://how2matplotlib.com/sine') # URL for sine wave info
# Plot cosine wave and set URL
line2, = ax.plot(x, y2, label='Cosine')
line2.set_url('https://how2matplotlib.com/cosine') # URL for cosine wave info
# Add legend with URLs
legend = ax.legend()
for text in legend.get_texts():
text.set_url(f'https://how2matplotlib.com/{text.get_text().lower()}')
plt.title('Interactive Trigonometric Functions')
plt.xlabel('x')
plt.ylabel('y')
# Add text explaining interactive features
plt.figtext(0.5, -0.1, 'Interactive elements: Click on lines or legend entries for more info',
ha='center', fontsize=8)
plt.show()
Output:
This example includes clear comments, a legend with interactive elements, and explanatory text about the interactive features.
Future Developments and Trends
As data visualization continues to evolve, we can expect to see further developments in the functionality and applications of Matplotlib.artist.Artist.set_url(). Some potential future trends include:
- Enhanced integration with web technologies for more seamless interactive visualizations.
- Improved support for mobile devices and touch interfaces.
- Integration with machine learning models to provide dynamic, data-driven URLs.
- Enhanced accessibility features for users with disabilities.
While we can’t predict exactly how Matplotlib.artist.Artist.set_url() will evolve, staying up-to-date with the latest Matplotlib releases and data visualization trends will help you make the most of this powerful feature.
Conclusion
Matplotlib.artist.Artist.set_url() is a powerful tool for creating interactive and informative data visualizations in Python. By associating URLs with different elements of your plots, you can provide additional context, create clickable elements, and enhance the overall user experience of your visualizations.