Comprehensive Guide to Using Matplotlib.artist.Artist.set_transform() in Python for Data Visualization
Matplotlib.artist.Artist.set_transform() in Python is a powerful method that allows you to manipulate the transformation of Artist objects in Matplotlib. This function is essential for creating complex and customized visualizations by altering the position, scale, and orientation of graphical elements. In this comprehensive guide, we’ll explore the various aspects of Matplotlib.artist.Artist.set_transform() in Python, providing detailed explanations and practical examples to help you master this important feature of Matplotlib.
Understanding Matplotlib.artist.Artist.set_transform() in Python
Matplotlib.artist.Artist.set_transform() in Python is a method that belongs to the Artist class in Matplotlib. It is used to set the transformation for an Artist object, which can be any graphical element in a Matplotlib plot, such as lines, text, or shapes. The transform determines how the Artist is positioned and scaled within the plot.
The basic syntax for using Matplotlib.artist.Artist.set_transform() in Python is as follows:
import matplotlib.pyplot as plt
import matplotlib.transforms as transforms

fig, ax = plt.subplots()
artist = ax.plot([0, 1], [0, 1], label='how2matplotlib.com')[0]
transform = transforms.Affine2D().rotate_deg(45) + ax.transData
artist.set_transform(transform)
plt.show()
Output:
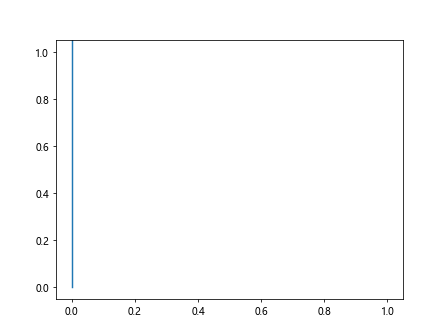
In this example, we create a simple line plot and then apply a rotation transform to it using Matplotlib.artist.Artist.set_transform() in Python. The line is rotated 45 degrees around its origin.
Types of Transforms in Matplotlib
When using Matplotlib.artist.Artist.set_transform() in Python, you can apply various types of transforms to your Artist objects. Let’s explore some of the most common transform types:
1. Translation Transform
A translation transform moves the Artist object to a new position without changing its shape or orientation. Here’s an example using Matplotlib.artist.Artist.set_transform() in Python to apply a translation:
import matplotlib.pyplot as plt
import matplotlib.transforms as transforms

fig, ax = plt.subplots()
circle = plt.Circle((0, 0), 0.5, label='how2matplotlib.com')
ax.add_artist(circle)

transform = transforms.Affine2D().translate(1, 1) + ax.transData
circle.set_transform(transform)

ax.set_xlim(-2, 2)
ax.set_ylim(-2, 2)
plt.show()
Output:
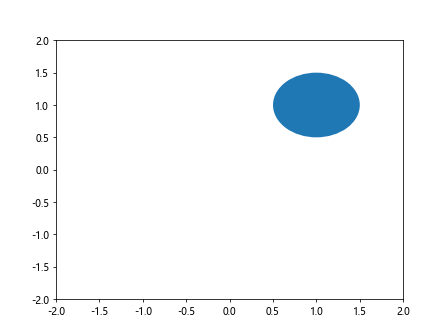
In this example, we create a circle at the origin and then use Matplotlib.artist.Artist.set_transform() in Python to translate it 1 unit to the right and 1 unit up.
2. Scaling Transform
A scaling transform changes the size of the Artist object. Here’s how you can use Matplotlib.artist.Artist.set_transform() in Python to apply a scaling transform:
import matplotlib.pyplot as plt
import matplotlib.transforms as transforms

fig, ax = plt.subplots()
rectangle = plt.Rectangle((0, 0), 1, 1, label='how2matplotlib.com')
ax.add_artist(rectangle)

transform = transforms.Affine2D().scale(2, 0.5) + ax.transData
rectangle.set_transform(transform)

ax.set_xlim(-1, 3)
ax.set_ylim(-1, 2)
plt.show()
Output:
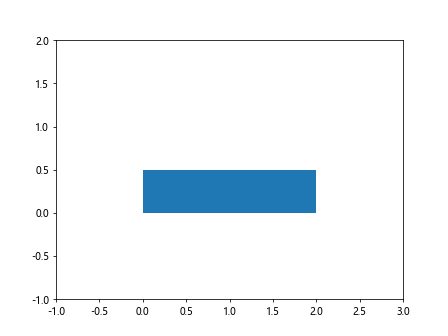
This example creates a rectangle and uses Matplotlib.artist.Artist.set_transform() in Python to scale it horizontally by a factor of 2 and vertically by a factor of 0.5.
3. Rotation Transform
A rotation transform rotates the Artist object around a specified point. Here’s an example using Matplotlib.artist.Artist.set_transform() in Python for rotation:
import matplotlib.pyplot as plt
import matplotlib.transforms as transforms
import numpy as np

fig, ax = plt.subplots()
x = np.linspace(0, 1, 100)
y = np.sin(2 * np.pi * x)
line, = ax.plot(x, y, label='how2matplotlib.com')

transform = transforms.Affine2D().rotate_deg(30) + ax.transData
line.set_transform(transform)

ax.set_xlim(-0.5, 1.5)
ax.set_ylim(-1.5, 1.5)
plt.show()
Output:
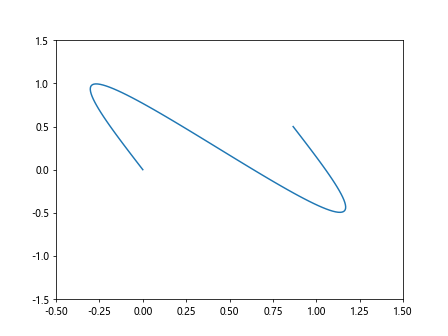
In this example, we create a sine wave and use Matplotlib.artist.Artist.set_transform() in Python to rotate it by 30 degrees around the origin.
Combining Transforms
One of the powerful features of Matplotlib.artist.Artist.set_transform() in Python is the ability to combine multiple transforms. You can create complex transformations by chaining different transform operations. Here’s an example:
import matplotlib.pyplot as plt
import matplotlib.transforms as transforms

fig, ax = plt.subplots()
triangle = plt.Polygon([(0, 0), (1, 0), (0.5, 1)], label='how2matplotlib.com')
ax.add_artist(triangle)

transform = (transforms.Affine2D().rotate_deg(45).translate(1, 1).scale(2, 2)
             + ax.transData)
triangle.set_transform(transform)

ax.set_xlim(-1, 5)
ax.set_ylim(-1, 5)
plt.show()
Output:
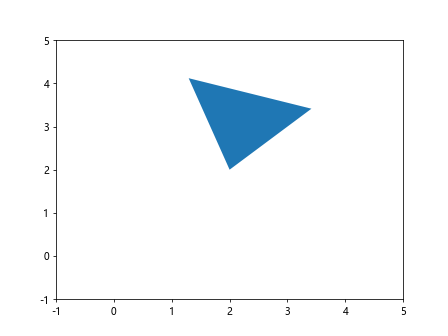
In this example, we create a triangle and use Matplotlib.artist.Artist.set_transform() in Python to apply a combination of rotation, translation, and scaling transforms.
Using Matplotlib.artist.Artist.set_transform() with Different Artist Types
Matplotlib.artist.Artist.set_transform() in Python can be applied to various types of Artist objects. Let’s explore how to use it with different plot elements:
1. Line Plots
Here’s an example of using Matplotlib.artist.Artist.set_transform() in Python with a line plot:
import matplotlib.pyplot as plt
import matplotlib.transforms as transforms
import numpy as np

fig, ax = plt.subplots()
x = np.linspace(0, 10, 100)
y = np.sin(x)
line, = ax.plot(x, y, label='how2matplotlib.com')

transform = transforms.Affine2D().skew(0.5, 0) + ax.transData
line.set_transform(transform)

ax.set_xlim(0, 15)
ax.set_ylim(-1.5, 1.5)
plt.show()
Output:
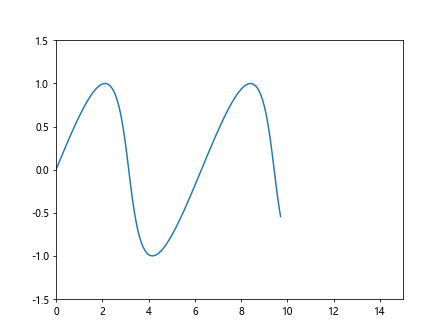
This example creates a sine wave and uses Matplotlib.artist.Artist.set_transform() in Python to apply a skew transformation to the line.
2. Scatter Plots
Matplotlib.artist.Artist.set_transform() in Python can also be applied to scatter plots:
import matplotlib.pyplot as plt
import matplotlib.transforms as transforms
import numpy as np

fig, ax = plt.subplots()
x = np.random.rand(50)
y = np.random.rand(50)
scatter = ax.scatter(x, y, label='how2matplotlib.com')

transform = transforms.Affine2D().scale(2, 0.5) + ax.transData
scatter.set_transform(transform)

ax.set_xlim(0, 2)
ax.set_ylim(0, 1)
plt.show()
Output:
In this example, we create a scatter plot and use Matplotlib.artist.Artist.set_transform() in Python to scale the points horizontally and vertically.
3. Text Objects
Matplotlib.artist.Artist.set_transform() in Python can be used to transform text objects as well:
import matplotlib.pyplot as plt
import matplotlib.transforms as transforms

fig, ax = plt.subplots()
text = ax.text(0.5, 0.5, 'how2matplotlib.com', ha='center', va='center')

transform = transforms.Affine2D().rotate_deg(45) + ax.transData
text.set_transform(transform)

ax.set_xlim(0, 1)
ax.set_ylim(0, 1)
plt.show()
Output:
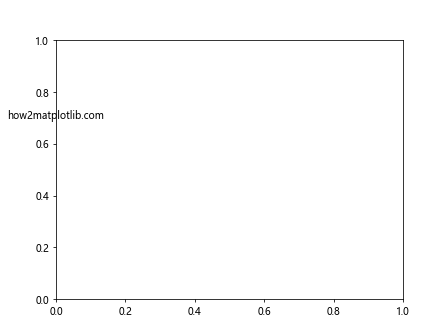
This example creates a text object and uses Matplotlib.artist.Artist.set_transform() in Python to rotate it by 45 degrees.
Advanced Techniques with Matplotlib.artist.Artist.set_transform()
Now that we’ve covered the basics, let’s explore some advanced techniques using Matplotlib.artist.Artist.set_transform() in Python:
1. Animated Transforms
You can create animated plots by updating the transform in a loop. Here’s an example:
import matplotlib.pyplot as plt
import matplotlib.transforms as transforms
import numpy as np

fig, ax = plt.subplots()
line, = ax.plot([0, 1], [0, 1], label='how2matplotlib.com')

ax.set_xlim(-2, 2)
ax.set_ylim(-2, 2)

for angle in range(0, 360, 5):
    transform = transforms.Affine2D().rotate_deg(angle) + ax.transData
    line.set_transform(transform)
    plt.pause(0.1)

plt.show()
Output:
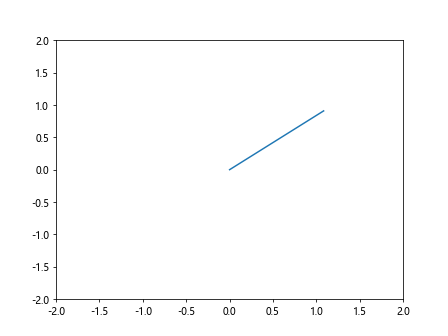
This example creates a rotating line using Matplotlib.artist.Artist.set_transform() in Python in a loop to update the rotation angle.
2. Custom Transform Functions
You can create custom transform functions to apply more complex transformations:
import matplotlib.pyplot as plt
import matplotlib.transforms as transforms
import numpy as np

def custom_transform(x, y):
    return x + np.sin(y), y + np.cos(x)

fig, ax = plt.subplots()
x = np.linspace(0, 5, 100)
y = np.linspace(0, 5, 100)
X, Y = np.meshgrid(x, y)
Z = np.sin(X) * np.cos(Y)

contour = ax.contourf(X, Y, Z)

transform = transforms.Affine2D().transform(custom_transform) + ax.transData
for collection in contour.collections:
    collection.set_transform(transform)

ax.set_xlim(0, 10)
ax.set_ylim(0, 10)
plt.show()
In this example, we define a custom transform function and use Matplotlib.artist.Artist.set_transform() in Python to apply it to a contour plot.
3. Transforming Subplots
You can use Matplotlib.artist.Artist.set_transform() in Python to transform entire subplots:
import matplotlib.pyplot as plt
import matplotlib.transforms as transforms

fig, (ax1, ax2) = plt.subplots(1, 2, figsize=(10, 5))

ax1.plot([0, 1], [0, 1], label='how2matplotlib.com')
ax2.plot([0, 1], [1, 0], label='how2matplotlib.com')

transform = transforms.Affine2D().rotate_deg(30)
for ax in (ax1, ax2):
    ax.set_transform(transform + ax.transData)

plt.show()
Output:
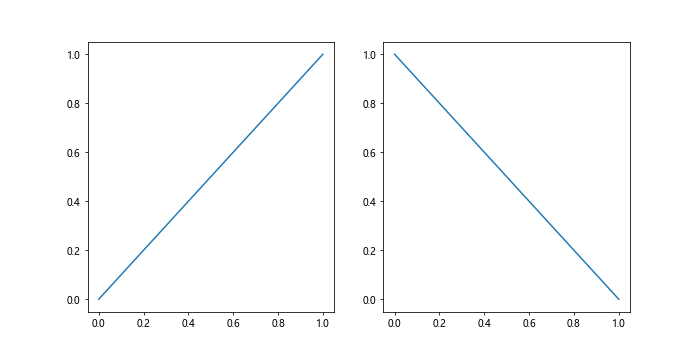
This example creates two subplots and uses Matplotlib.artist.Artist.set_transform() in Python to rotate both of them.
Best Practices for Using Matplotlib.artist.Artist.set_transform()
When working with Matplotlib.artist.Artist.set_transform() in Python, it’s important to follow some best practices to ensure your visualizations are effective and efficient:
- Understand the coordinate systems: Matplotlib uses different coordinate systems (data coordinates, axes coordinates, figure coordinates). Make sure you understand which system you’re working in when applying transforms.
Use the appropriate transform: Choose the right transform for your needs. For example, use
ax.transDatafor data coordinates andax.transAxesfor axes coordinates.Combine transforms efficiently: When combining multiple transforms, try to minimize the number of operations to improve performance.
Be mindful of the order of operations: The order in which you apply transforms matters. For example, rotating and then translating will give a different result than translating and then rotating.
Update limits after transforming: After applying transforms, you may need to update the axis limits to ensure all elements are visible.
Use blended transforms: For more complex visualizations, consider using blended transforms that combine different coordinate systems.
Here’s an example demonstrating some of these best practices: