Comprehensive Guide to Matplotlib.artist.Artist.update() in Python:

Comprehensive Guide to Matplotlib.artist.Artist.update() in Python:

Matplotlib.artist.Artist.update() in Python is a powerful method that allows you to update the properties of an Artist object in Matplotlib. This function is essential for creating dynamic and interactive visualizations, as it enables you to modify various aspects of your plots on the fly. In this comprehensive guide, we’ll explore the ins and outs of Matplotlib.artist.Artist.update(), providing you with detailed explanations and practical examples to help you master this crucial aspect of data visualization in Python.

Understanding Matplotlib.artist.Artist.update() and Its Importance

Matplotlib.artist.Artist.update() is a method that belongs to the Artist class in Matplotlib. The Artist class is the base class for all visible elements in a Matplotlib figure, including lines, text, patches, and more. The update() method allows you to modify the properties of these Artist objects after they have been created, providing a flexible way to adjust your visualizations dynamically.

The importance of Matplotlib.artist.Artist.update() lies in its ability to:

  1. Modify existing plot elements without recreating them
  2. Update multiple properties of an Artist object in a single call
  3. Improve performance by avoiding unnecessary redraws
  4. Enable interactive and animated visualizations

Let’s dive deeper into how Matplotlib.artist.Artist.update() works and explore its various applications.

Basic Syntax and Usage of Matplotlib.artist.Artist.update()

The basic syntax for using Matplotlib.artist.Artist.update() is as follows:

artist.update(props)

Where artist is an instance of an Artist object, and props is a dictionary containing the properties you want to update and their new values.

Here’s a simple example to illustrate the usage of Matplotlib.artist.Artist.update():

import matplotlib.pyplot as plt

# Create a figure and axis
fig, ax = plt.subplots()

# Plot a line
line, = ax.plot([1, 2, 3, 4], [1, 4, 2, 3], label='Original Line')

# Update the line properties
line.update({'color': 'red', 'linewidth': 2, 'linestyle': '--'})

plt.title('How to use Matplotlib.artist.Artist.update() - how2matplotlib.com')
plt.legend()
plt.show()

Output:
Comprehensive Guide to Matplotlib.artist.Artist.update() in Python:

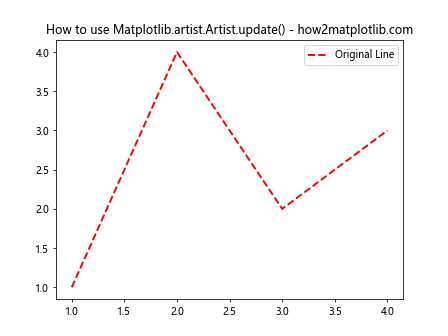
In this example, we create a simple line plot and then use Matplotlib.artist.Artist.update() to change the color, line width, and line style of the line. The update() method allows us to modify multiple properties in a single call, making it more efficient than setting each property individually.

Updating Different Types of Artists with Matplotlib.artist.Artist.update()

Matplotlib.artist.Artist.update() can be used with various types of Artist objects. Let’s explore how to update different types of artists using this method.

Updating Line2D Objects

Line2D objects represent lines in a plot. Here’s an example of updating a Line2D object:

import matplotlib.pyplot as plt

fig, ax = plt.subplots()

# Create a line
line, = ax.plot([1, 2, 3, 4], [1, 4, 2, 3], label='Original Line')

# Update line properties
line.update({
    'color': 'blue',
    'linewidth': 3,
    'linestyle': ':',
    'marker': 'o',
    'markersize': 8,
    'markerfacecolor': 'red',
    'markeredgecolor': 'black'
})

plt.title('Updating Line2D with Matplotlib.artist.Artist.update() - how2matplotlib.com')
plt.legend()
plt.show()

Output:
Comprehensive Guide to Matplotlib.artist.Artist.update() in Python:

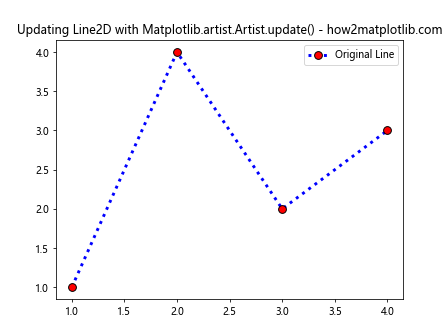
In this example, we use Matplotlib.artist.Artist.update() to modify various properties of the Line2D object, including color, line width, line style, marker type, marker size, and marker colors.

Updating Text Objects

Text objects represent text elements in a plot. Here’s how you can update a Text object:

import matplotlib.pyplot as plt

fig, ax = plt.subplots()

# Create a text object
text = ax.text(0.5, 0.5, 'Original Text', ha='center', va='center')

# Update text properties
text.update({
    'text': 'Updated Text',
    'fontsize': 16,
    'color': 'green',
    'rotation': 45,
    'fontweight': 'bold',
    'fontstyle': 'italic'
})

plt.title('Updating Text with Matplotlib.artist.Artist.update() - how2matplotlib.com')
plt.xlim(0, 1)
plt.ylim(0, 1)
plt.show()

Output:
Comprehensive Guide to Matplotlib.artist.Artist.update() in Python:

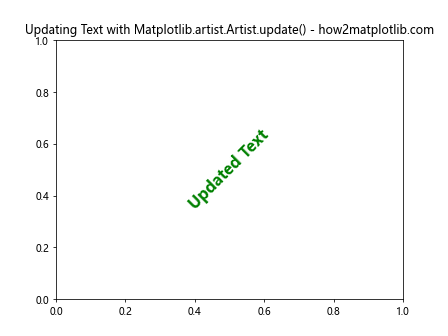
In this example, we use Matplotlib.artist.Artist.update() to change the text content, font size, color, rotation, font weight, and font style of a Text object.

Updating Patch Objects

Patch objects represent filled shapes in a plot. Here’s an example of updating a Rectangle patch:

import matplotlib.pyplot as plt
from matplotlib.patches import Rectangle

fig, ax = plt.subplots()

# Create a rectangle patch
rect = Rectangle((0.2, 0.2), 0.6, 0.6, facecolor='blue', edgecolor='black')
ax.add_patch(rect)

# Update patch properties
rect.update({
    'facecolor': 'yellow',
    'edgecolor': 'red',
    'linewidth': 3,
    'alpha': 0.7,
    'linestyle': '--'
})

plt.title('Updating Patch with Matplotlib.artist.Artist.update() - how2matplotlib.com')
plt.xlim(0, 1)
plt.ylim(0, 1)
plt.show()

Output:
Comprehensive Guide to Matplotlib.artist.Artist.update() in Python:

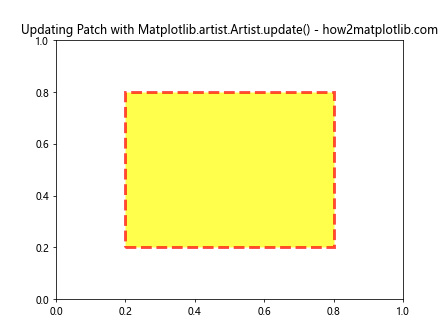
In this example, we use Matplotlib.artist.Artist.update() to modify the face color, edge color, line width, transparency, and line style of a Rectangle patch.

Advanced Techniques with Matplotlib.artist.Artist.update()

Now that we’ve covered the basics, let’s explore some advanced techniques using Matplotlib.artist.Artist.update().

Updating Multiple Artists at Once

You can update multiple artists simultaneously using a loop or list comprehension. Here’s an example:

import matplotlib.pyplot as plt
import numpy as np

fig, ax = plt.subplots()

# Create multiple lines
lines = [ax.plot(np.random.rand(10))[0] for _ in range(5)]

# Update all lines at once
for line in lines:
    line.update({
        'color': np.random.rand(3),
        'linewidth': np.random.randint(1, 5),
        'linestyle': np.random.choice(['-', '--', ':', '-.'])
    })

plt.title('Updating Multiple Artists with Matplotlib.artist.Artist.update() - how2matplotlib.com')
plt.show()

Output:
Comprehensive Guide to Matplotlib.artist.Artist.update() in Python:

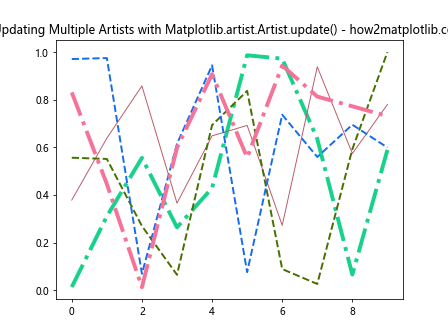
In this example, we create multiple lines and update their properties using Matplotlib.artist.Artist.update() in a loop, assigning random colors, line widths, and line styles to each line.

Updating Artists Based on Data

You can use Matplotlib.artist.Artist.update() to update artists based on changing data. Here’s an example of a simple animation:

import matplotlib.pyplot as plt
import numpy as np
from matplotlib.animation import FuncAnimation

fig, ax = plt.subplots()

# Create initial line
x = np.linspace(0, 2*np.pi, 100)
line, = ax.plot(x, np.sin(x))

def update(frame):
    # Update line data
    y = np.sin(x + frame/10)
    line.set_ydata(y)

    # Update line properties based on data
    line.update({
        'color': plt.cm.viridis(frame/100),
        'linewidth': 1 + frame/50
    })
    return line,

ani = FuncAnimation(fig, update, frames=100, interval=50, blit=True)

plt.title('Updating Artists Based on Data with Matplotlib.artist.Artist.update() - how2matplotlib.com')
plt.show()

Output:
Comprehensive Guide to Matplotlib.artist.Artist.update() in Python:

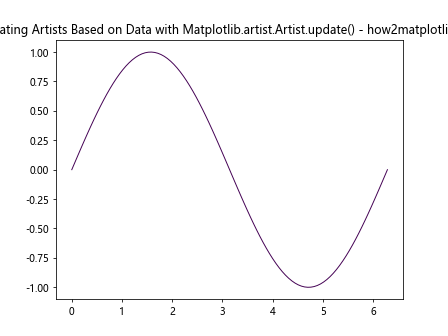
In this example, we create an animation where the line’s data and properties are updated based on the current frame. Matplotlib.artist.Artist.update() is used to change the line’s color and width dynamically.

Updating Artists in Response to User Interaction

Matplotlib.artist.Artist.update() can be used to create interactive visualizations that respond to user input. Here’s an example of a plot that updates when the user clicks on it:

import matplotlib.pyplot as plt
import numpy as np

fig, ax = plt.subplots()

# Create initial scatter plot
x = np.random.rand(20)
y = np.random.rand(20)
scatter = ax.scatter(x, y, c='blue', s=50)

def on_click(event):
    if event.inaxes == ax:
        # Add new point
        new_x, new_y = event.xdata, event.ydata
        x.append(new_x)
        y.append(new_y)

        # Update scatter plot
        scatter.set_offsets(np.column_stack((x, y)))
        scatter.update({
            'sizes': np.linspace(20, 200, len(x)),
            'color': plt.cm.viridis(np.linspace(0, 1, len(x)))
        })

        fig.canvas.draw_idle()

fig.canvas.mpl_connect('button_press_event', on_click)

plt.title('Interactive Plot with Matplotlib.artist.Artist.update() - how2matplotlib.com')
plt.xlim(0, 1)
plt.ylim(0, 1)
plt.show()

Output:
Comprehensive Guide to Matplotlib.artist.Artist.update() in Python:

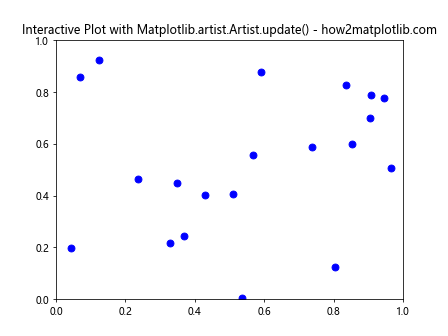
In this example, we create an interactive scatter plot that adds new points when the user clicks on the plot. Matplotlib.artist.Artist.update() is used to update the sizes and colors of the scatter points based on the number of points.

Best Practices and Performance Considerations

When using Matplotlib.artist.Artist.update(), it’s important to keep in mind some best practices and performance considerations:

  1. Update multiple properties at once: Instead of calling update() multiple times for different properties, combine them into a single dictionary to improve performance.

  2. Use set_* methods for single property updates: For updating a single property, using the specific set_* method (e.g., set_color()) can be more efficient than update().

  3. Avoid unnecessary updates: Only update properties that have actually changed to prevent unnecessary redraws.

  4. Use blitting for animations: When creating animations, use the blit parameter in FuncAnimation to improve performance by only redrawing the changed parts of the plot.

  5. Consider using collections: For large numbers of similar artists (e.g., many scatter points), using collections can be more efficient than individual artists.

Here’s an example demonstrating some of these best practices:

import matplotlib.pyplot as plt
import numpy as np
from matplotlib.animation import FuncAnimation

fig, ax = plt.subplots()

# Create a scatter plot using a collection
n_points = 1000
x = np.random.rand(n_points)
y = np.random.rand(n_points)
colors = np.random.rand(n_points)
sizes = np.random.randint(10, 100, n_points)

scatter = ax.scatter(x, y, c=colors, s=sizes, cmap='viridis')

def update(frame):
    # Update only changed properties
    new_sizes = sizes + frame
    new_colors = colors + frame/100

    scatter.set_sizes(new_sizes)
    scatter.set_array(new_colors)

    return scatter,

ani = FuncAnimation(fig, update, frames=100, interval=50, blit=True)

plt.title('Best Practices with Matplotlib.artist.Artist.update() - how2matplotlib.com')
plt.colorbar(scatter)
plt.show()

Output:

Comprehensive Guide to Matplotlib.artist.Artist.update() in Python:

In this example, we use a scatter collection for better performance with a large number of points. We also use set_* methods for updating individual properties and enable blitting in the animation for improved performance.

Integrating Matplotlib.artist.Artist.update() with Other Matplotlib Features

Matplotlib.artist.Artist.update() can be integrated with other Matplotlib features to create more complex and dynamic visualizations. Let’s explore some examples of how to combine update() with other Matplotlib functionality.

Combining with Subplots

You can use Matplotlib.artist.Artist.update() across multiple subplots to create coordinated visualizations:

import matplotlib.pyplot as plt
import numpy as np

fig, (ax1, ax2) = plt.subplots(1, 2, figsize=(12, 5))

# Create lines in both subplots
x = np.linspace(0, 10, 100)
line1, = ax1.plot(x, np.sin(x))
line2, = ax2.plot(x, np.cos(x))

# Update both lines
line1.update({'color': 'red', 'linewidth': 2, 'linestyle': '--'})
line2.update({'color': 'blue', 'linewidth': 2, 'linestyle': ':'})

ax1.set_title('Sine Wave')
ax2.set_title('Cosine Wave')
fig.suptitle('Using Matplotlib.artist.Artist.update() with Subplots - how2matplotlib.com')

plt.tight_layout()
plt.show()

Output:

Comprehensive Guide to Matplotlib.artist.Artist.update() in Python:

In this example, we create two subplots and use Matplotlib.artist.Artist.update() to modify the properties of lines in both subplots.

Integrating with Custom Colormaps

You can use Matplotlib.artist.Artist.update() in combination with custom colormaps to create unique visualizations:

import matplotlib.pyplot as plt
import numpy as np
from matplotlib.colors import LinearSegmentedColormap

# Create custom colormap
colors = ['#ff0000', '#00ff00', '#0000ff']
n_bins = 100
cmap = LinearSegmentedColormap.from_list('custom_cmap', colors, N=n_bins)

fig, ax = plt.subplots()

# Create scatter plot
n_points = 1000
x = np.random.rand(n_points)
y = np.random.rand(n_points)
scatter = ax.scatter(x, y, c=np.random.rand(n_points), cmap=cmap, s=50)

# Update scatter plot with new colormap
scatter.update({'cmap': plt.cm.viridis})

plt.title('Integrating Matplotlib.artist.Artist.update() with Custom Colormaps - how2matplotlib.com')
plt.colorbar(scatter)
plt.show()

Output:

Comprehensive Guide to Matplotlib.artist.Artist.update() in Python:

In this example, we create a custom colormap and use it for a scatter plot. We then use Matplotlib.artist.Artist.update() to change the colormap to a built-in one.

Advanced Applications of Matplotlib.artist.Artist.update()

Let’s explore some advanced applications of Matplotlib.artist.Artist.update() to create more complex and interactive visualizations.

Creating a Dynamic Heatmap

We can use Matplotlib.artist.Artist.update() to create a dynamic heatmap that updates based on user input:

import matplotlib.pyplot as plt
import numpy as np

fig, ax = plt.subplots()

# Create initial heatmap
data = np.random.rand(10, 10)
heatmap = ax.imshow(data, cmap='viridis')

def update_heatmap(event):
    if event.inaxes == ax:
        i, j = int(event.ydata), int(event.xdata)
        data[i, j] = np.random.rand()
        heatmap.set_array(data)
        fig.canvas.draw_idle()

fig.canvas.mpl_connect('button_press_event', update_heatmap)

plt.title('Dynamic Heatmap using Matplotlib.artist.Artist.update() - how2matplotlib.com')
plt.colorbar(heatmap)
plt.show()

Output:

Comprehensive Guide to Matplotlib.artist.Artist.update() in Python:

In this example, we create a heatmap that updates when the user clicks on a cell. Matplotlib.artist.Artist.update() is used implicitly through the set_array() method to update the heatmap data.

Creating a Real-time Data Visualization

We can use Matplotlib.artist.Artist.update() to create a real-time data visualization that updates continuously:

import matplotlib.pyplot as plt
import numpy as np
from matplotlib.animation import FuncAnimation

fig, ax = plt.subplots()

# Initialize data
x = np.linspace(0, 10, 100)
y = np.sin(x)
line, = ax.plot(x, y)

# Create text objects for statistics
mean_text = ax.text(0.02, 0.95, '', transform=ax.transAxes)
std_text = ax.text(0.02, 0.90, '', transform=ax.transAxes)

def update(frame):
    # Update data
    new_y = np.sin(x + frame/10) + np.random.normal(0, 0.1, len(x))
    line.set_ydata(new_y)

    # Update statistics
    mean = np.mean(new_y)
    std = np.std(new_y)
    mean_text.set_text(f'Mean: {mean:.2f}')
    std_text.set_text(f'Std: {std:.2f}')

    # Update line properties based on statistics
    line.update({
        'color': plt.cm.viridis(mean),
        'linewidth': 1 + std
    })

    return line, mean_text, std_text

ani = FuncAnimation(fig, update, frames=200, interval=50, blit=True)

plt.title('Real-time Data Visualization with Matplotlib.artist.Artist.update() - how2matplotlib.com')
plt.show()

Output:

Comprehensive Guide to Matplotlib.artist.Artist.update() in Python:

In this example, we create a real-time visualization of a sine wave with added noise. Matplotlib.artist.Artist.update() is used to update the line properties based on the current statistics of the data.

Comparing Matplotlib.artist.Artist.update() with Other Update Methods

While Matplotlib.artist.Artist.update() is a powerful method for updating artist properties, it’s worth comparing it with other update methods available in Matplotlib:

  1. Direct attribute setting
  2. set_* methods
  3. setp() function

Let’s compare these methods:

import matplotlib.pyplot as plt
import time

fig, (ax1, ax2, ax3, ax4) = plt.subplots(1, 4, figsize=(16, 4))

# Create lines in all subplots
line1, = ax1.plot([1, 2, 3], [1, 2, 3])
line2, = ax2.plot([1, 2, 3], [1, 2, 3])
line3, = ax3.plot([1, 2, 3], [1, 2, 3])
line4, = ax4.plot([1, 2, 3], [1, 2, 3])

# Method 1: Direct attribute setting
start_time = time.time()
line1.set_color('red')
line1.set_linewidth(2)
line1.set_linestyle('--')
method1_time = time.time() - start_time

# Method 2: set_* methods
start_time = time.time()
line2.set_color('green')
line2.set_linewidth(2)
line2.set_linestyle(':')
method2_time = time.time() - start_time

# Method 3: setp() function
start_time = time.time()
plt.setp(line3, color='blue', linewidth=2, linestyle='-.')
method3_time = time.time() - start_time

# Method 4: Matplotlib.artist.Artist.update()
start_time = time.time()
line4.update({'color': 'purple', 'linewidth': 2, 'linestyle': '-'})
method4_time = time.time() - start_time

# Set titles and display execution times
ax1.set_title(f'Direct\n{method1_time:.6f}s')
ax2.set_title(f'set_*\n{method2_time:.6f}s')
ax3.set_title(f'setp()\n{method3_time:.6f}s')
ax4.set_title(f'update()\n{method4_time:.6f}s')

fig.suptitle('Comparing Update Methods in Matplotlib - how2matplotlib.com')
plt.tight_layout()
plt.show()

Output:

Comprehensive Guide to Matplotlib.artist.Artist.update() in Python:

In this example, we compare the execution time of different update methods. While the differences may be negligible for small updates, Matplotlib.artist.Artist.update() can be more efficient when updating multiple properties at once, especially for large numbers of artists.

Conclusion

Matplotlib.artist.Artist.update() is a versatile and powerful method for modifying the properties of Matplotlib artists. Throughout this comprehensive guide, we’ve explored its basic usage, advanced techniques, best practices, and integration with other Matplotlib features. By mastering Matplotlib.artist.Artist.update(), you can create more dynamic, interactive, and efficient data visualizations in Python.

Like(0)

Matplotlib Articles