Comprehensive Guide to Using Matplotlib.axes.Axes.add_callback() in Python for Data Visualization
Matplotlib.axes.Axes.add_callback() in Python is a powerful method that allows you to add callback functions to Axes objects in Matplotlib. This function is essential for creating interactive and dynamic visualizations, enabling you to respond to changes in the Axes properties. In this comprehensive guide, we’ll explore the ins and outs of Matplotlib.axes.Axes.add_callback(), providing detailed explanations and numerous examples to help you master this feature.
Understanding Matplotlib.axes.Axes.add_callback()
Matplotlib.axes.Axes.add_callback() is a method that belongs to the Axes class in Matplotlib. It allows you to register a callback function that will be called whenever certain properties of the Axes object change. This is particularly useful for creating interactive plots or updating visualizations based on user input or data changes.
The basic syntax of Matplotlib.axes.Axes.add_callback() is as follows:
import matplotlib.pyplot as plt

fig, ax = plt.subplots()
callback_id = ax.add_callback(func)
Here, func is the callback function that you want to register. The method returns a callback ID that can be used later to remove the callback if needed.
Let’s dive deeper into how to use Matplotlib.axes.Axes.add_callback() effectively in your Python projects.
Creating a Simple Callback Function
To start with Matplotlib.axes.Axes.add_callback(), let’s create a simple callback function that prints a message whenever it’s called. This will help us understand when the callback is triggered.
import matplotlib.pyplot as plt

def simple_callback(ax):
    print("Callback triggered for Axes on how2matplotlib.com")

fig, ax = plt.subplots()
callback_id = ax.add_callback(simple_callback)

ax.set_xlim(0, 10)  # This will trigger the callback
plt.show()
Output:
In this example, we define a simple callback function that prints a message. We then create a figure and an Axes object, add the callback using Matplotlib.axes.Axes.add_callback(), and set the x-axis limits. Setting the limits triggers the callback, and you’ll see the message printed.
Responding to Axis Limit Changes
One common use of Matplotlib.axes.Axes.add_callback() is to respond to changes in the axis limits. This can be useful for updating other parts of your visualization or performing calculations based on the visible data range.
import matplotlib.pyplot as plt
import numpy as np

def limit_callback(ax):
    xlim = ax.get_xlim()
    ylim = ax.get_ylim()
    print(f"X limits: {xlim}, Y limits: {ylim} on how2matplotlib.com")

fig, ax = plt.subplots()
x = np.linspace(0, 10, 100)
y = np.sin(x)
ax.plot(x, y)

callback_id = ax.add_callback(limit_callback)

ax.set_xlim(2, 8)  # This will trigger the callback
ax.set_ylim(-0.5, 0.5)  # This will trigger the callback again
plt.show()
Output:
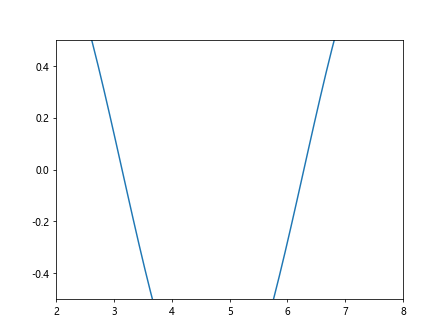
In this example, we create a callback function that prints the current x and y limits of the Axes. We then plot a sine wave and add the callback. When we set new limits for the x and y axes, the callback is triggered, and we see the updated limits printed.
Updating Annotations Based on Axis Changes
Matplotlib.axes.Axes.add_callback() can be particularly useful for updating annotations or text elements in your plot based on changes to the Axes properties. Here’s an example that updates a text annotation with the current axis limits:
import matplotlib.pyplot as plt
import numpy as np

def update_annotation(ax):
    xlim = ax.get_xlim()
    ylim = ax.get_ylim()
    ax.texts[0].set_text(f"X: {xlim[0]:.2f} to {xlim[1]:.2f}\nY: {ylim[0]:.2f} to {ylim[1]:.2f}")

fig, ax = plt.subplots()
x = np.linspace(0, 10, 100)
y = np.cos(x)
ax.plot(x, y)

ax.text(0.05, 0.95, "", transform=ax.transAxes, va='top', ha='left')
callback_id = ax.add_callback(update_annotation)

ax.set_xlim(2, 8)
ax.set_ylim(-0.8, 0.8)
plt.title("Axis Limits on how2matplotlib.com")
plt.show()
Output:
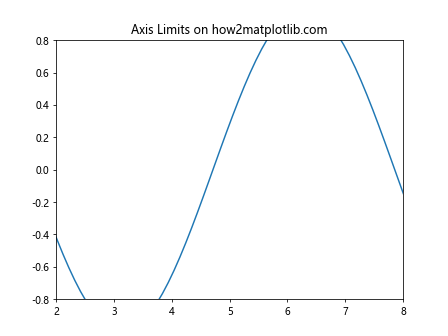
In this example, we create a callback function that updates a text annotation with the current axis limits. We add an empty text annotation to the plot and then register the callback. When we set new limits for the axes, the callback is triggered, and the annotation is updated with the new limit values.
Dynamically Updating Plot Elements
Matplotlib.axes.Axes.add_callback() can be used to dynamically update plot elements based on changes to the Axes. Here’s an example that updates the color of a line plot based on the x-axis range:
import matplotlib.pyplot as plt
import numpy as np

def update_line_color(ax):
    xlim = ax.get_xlim()
    mid = (xlim[0] + xlim[1]) / 2
    if mid < 5:
        ax.lines[0].set_color('red')
    else:
        ax.lines[0].set_color('blue')
    ax.figure.canvas.draw_idle()

fig, ax = plt.subplots()
x = np.linspace(0, 10, 100)
y = np.sin(x)
line, = ax.plot(x, y)

callback_id = ax.add_callback(update_line_color)

ax.set_xlim(0, 4)  # This will set the line color to red
plt.title("Dynamic Line Color on how2matplotlib.com")
plt.show()
Output:
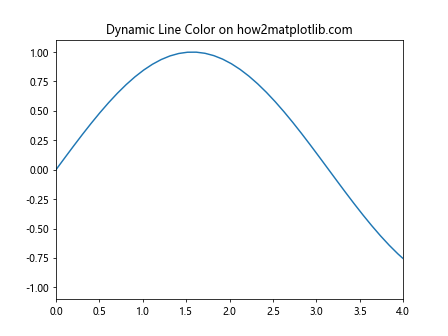
In this example, we create a callback function that changes the color of the line plot based on the midpoint of the x-axis range. We plot a sine wave and add the callback. When we set the x-axis limits, the callback is triggered, and the line color is updated accordingly.
Handling Multiple Callbacks
Matplotlib.axes.Axes.add_callback() allows you to add multiple callbacks to a single Axes object. This can be useful when you want to perform multiple actions in response to Axes property changes. Here's an example that demonstrates how to use multiple callbacks:
import matplotlib.pyplot as plt
import numpy as np

def callback1(ax):
    print("Callback 1 triggered on how2matplotlib.com")

def callback2(ax):
    print("Callback 2 triggered on how2matplotlib.com")

def callback3(ax):
    print("Callback 3 triggered on how2matplotlib.com")

fig, ax = plt.subplots()
x = np.linspace(0, 10, 100)
y = np.sin(x)
ax.plot(x, y)

callback_id1 = ax.add_callback(callback1)
callback_id2 = ax.add_callback(callback2)
callback_id3 = ax.add_callback(callback3)

ax.set_xlim(2, 8)  # This will trigger all three callbacks
plt.title("Multiple Callbacks on how2matplotlib.com")
plt.show()
Output:
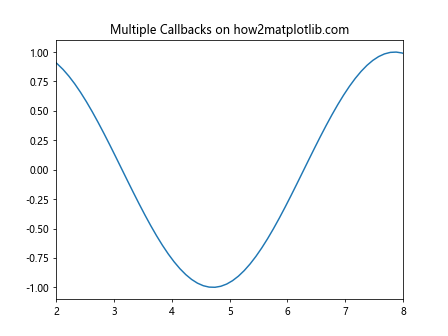
In this example, we define three separate callback functions and add them all to the same Axes object using Matplotlib.axes.Axes.add_callback(). When we change the x-axis limits, all three callbacks are triggered in the order they were added.
Removing Callbacks
Sometimes you may want to remove a callback that you've previously added. Matplotlib.axes.Axes.add_callback() returns a callback ID that you can use to remove the callback later. Here's an example of how to remove a callback:
import matplotlib.pyplot as plt
import numpy as np

def temporary_callback(ax):
    print("Temporary callback triggered on how2matplotlib.com")

fig, ax = plt.subplots()
x = np.linspace(0, 10, 100)
y = np.cos(x)
ax.plot(x, y)

callback_id = ax.add_callback(temporary_callback)

ax.set_xlim(2, 8)  # This will trigger the callback

ax.callbacks.disconnect(callback_id)

ax.set_ylim(-0.5, 0.5)  # This will not trigger the callback
plt.title("Removing Callbacks on how2matplotlib.com")
plt.show()
Output:
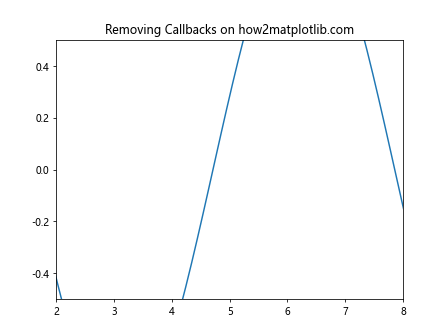
In this example, we add a temporary callback and then remove it using the disconnect method of the Axes' callbacks property. After removing the callback, changes to the Axes properties no longer trigger the callback function.
Using Matplotlib.axes.Axes.add_callback() with Subplots
Matplotlib.axes.Axes.add_callback() can be used with subplots to create more complex visualizations. Here's an example that demonstrates how to use callbacks with multiple subplots:
import matplotlib.pyplot as plt
import numpy as np

def update_subplot(ax, index):
    xlim = ax.get_xlim()
    ylim = ax.get_ylim()
    ax.set_title(f"Subplot {index+1}: X={xlim}, Y={ylim}")
    ax.figure.canvas.draw_idle()

fig, axs = plt.subplots(2, 2, figsize=(10, 10))
axs = axs.ravel()

for i, ax in enumerate(axs):
    x = np.linspace(0, 10, 100)
    y = np.sin(x + i)
    ax.plot(x, y)
    callback_id = ax.add_callback(lambda ax, i=i: update_subplot(ax, i))

plt.suptitle("Subplots with Callbacks on how2matplotlib.com")
plt.tight_layout()

# Trigger callbacks by changing limits
axs[0].set_xlim(2, 8)
axs[1].set_ylim(-0.5, 0.5)
axs[2].set_xlim(1, 9)
axs[3].set_ylim(-0.8, 0.8)

plt.show()
Output:
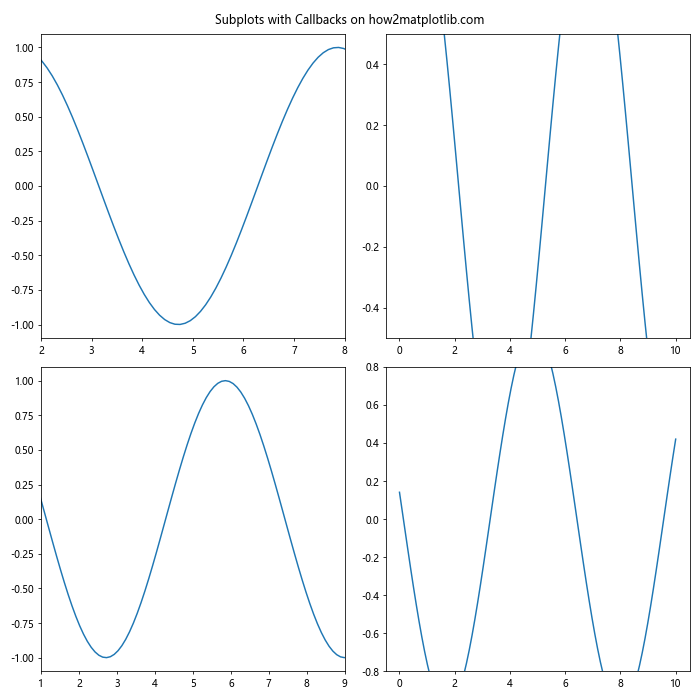
In this example, we create a 2x2 grid of subplots and add a callback to each subplot. The callback updates the title of the subplot with the current axis limits. We then trigger the callbacks by changing the limits of each subplot.
Combining Matplotlib.axes.Axes.add_callback() with Event Handling
Matplotlib.axes.Axes.add_callback() can be combined with Matplotlib's event handling system to create highly interactive visualizations. Here's an example that uses both callbacks and mouse click events:
import matplotlib.pyplot as plt
import numpy as np

def on_click(event):
    if event.inaxes == ax:
        ax.plot(event.xdata, event.ydata, 'ro')
        ax.figure.canvas.draw_idle()

def update_title(ax):
    num_points = len(ax.lines)
    ax.set_title(f"Clicked Points: {num_points} on how2matplotlib.com")

fig, ax = plt.subplots()
ax.set_xlim(0, 10)
ax.set_ylim(0, 10)

callback_id = ax.add_callback(update_title)
fig.canvas.mpl_connect('button_press_event', on_click)

plt.show()
Output:
In this example, we create a plot where the user can click to add points. We use an event handler to add points when the user clicks, and we use Matplotlib.axes.Axes.add_callback() to update the title with the number of points each time a new point is added.
Error Handling in Matplotlib.axes.Axes.add_callback()
When using Matplotlib.axes.Axes.add_callback(), it's important to handle potential errors that may occur in your callback functions. Unhandled errors in callbacks can lead to unexpected behavior or crashes. Here's an example that demonstrates how to implement error handling in callbacks:
import matplotlib.pyplot as plt
import numpy as np

def error_prone_callback(ax):
    try:
        # Simulate an error condition
        if np.random.rand() < 0.5:
            raise ValueError("Random error occurred")

        xlim = ax.get_xlim()
        ylim = ax.get_ylim()
        print(f"Limits: X={xlim}, Y={ylim} on how2matplotlib.com")
    except Exception as e:
        print(f"Error in callback: {e}")

fig, ax = plt.subplots()
x = np.linspace(0, 10, 100)
y = np.sin(x)
ax.plot(x, y)

callback_id = ax.add_callback(error_prone_callback)

for _ in range(5):
    ax.set_xlim(np.random.rand()*5, 5 + np.random.rand()*5)
    ax.set_ylim(-1 - np.random.rand(), 1 + np.random.rand())

plt.title("Error Handling in Callbacks on how2matplotlib.com")
plt.show()
Output:
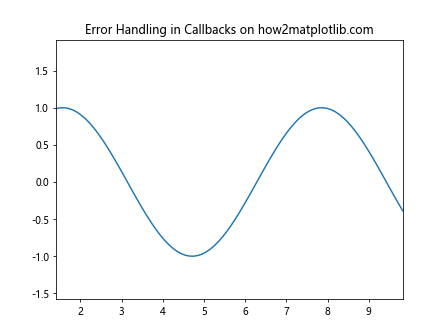
In this example, we create a callback function that simulates random errors. We use a try-except block to catch and handle these errors, preventing them from crashing the program or causing unexpected behavior.
Conclusion
Matplotlib.axes.Axes.add_callback() is a powerful tool in the Matplotlib library that allows you to create dynamic and interactive visualizations. By registering callback functions with Axes objects, you can respond to changes in axis properties, update plot elements, and create animated visualizations.