Comprehensive Guide to Matplotlib.pyplot.colorbar() Function in Python
Matplotlib.pyplot.colorbar() function in Python is an essential tool for data visualization enthusiasts and professionals alike. This powerful function adds a color scale to your plots, helping viewers interpret the meaning of colors in your visualizations. In this comprehensive guide, we’ll explore the ins and outs of the Matplotlib.pyplot.colorbar() function, providing you with the knowledge and skills to create stunning and informative visualizations.
Understanding the Basics of Matplotlib.pyplot.colorbar()
The Matplotlib.pyplot.colorbar() function is a crucial component of the Matplotlib library, which is widely used for creating static, animated, and interactive visualizations in Python. This function specifically adds a colorbar to your plot, which serves as a legend for the colors used in your visualization. It’s particularly useful when working with plots that use color to represent a third dimension of data, such as heatmaps, contour plots, or scatter plots with color-coded points.
Let’s start with a simple example to illustrate the basic usage of Matplotlib.pyplot.colorbar():
import matplotlib.pyplot as plt
import numpy as np

# Create some sample data
data = np.random.rand(10, 10)

# Create a heatmap
plt.imshow(data, cmap='viridis')

# Add a colorbar
plt.colorbar(label='How2Matplotlib.com Values')

plt.title('Basic Colorbar Example')
plt.show()
Output:
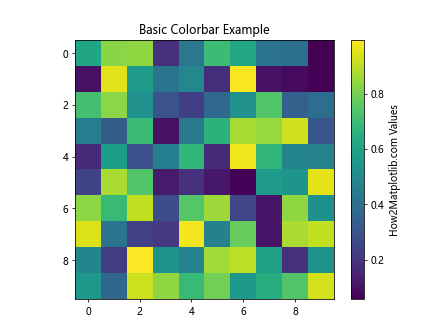
In this example, we create a simple heatmap using random data and add a colorbar to it. The colorbar function is called without any arguments, which means it will automatically use the most recently created mappable object (in this case, the heatmap created by imshow()).
Customizing Your Colorbar with Matplotlib.pyplot.colorbar()
The Matplotlib.pyplot.colorbar() function offers a wide range of customization options to help you create the perfect colorbar for your visualization. Let’s explore some of these options:
Changing the Colorbar Orientation
By default, the colorbar is displayed vertically on the right side of the plot. However, you can easily change its orientation and position:
import matplotlib.pyplot as plt
import numpy as np

data = np.random.rand(10, 10)

plt.imshow(data, cmap='coolwarm')

# Add a horizontal colorbar at the bottom
plt.colorbar(orientation='horizontal', label='How2Matplotlib.com Values', pad=0.2)

plt.title('Horizontal Colorbar Example')
plt.show()
Output:

In this example, we’ve changed the orientation to ‘horizontal’ and added some padding to move it further away from the plot.
Customizing Colorbar Ticks and Labels
You can also customize the ticks and labels on your colorbar to better suit your data:
import matplotlib.pyplot as plt
import numpy as np

data = np.random.rand(10, 10)

im = plt.imshow(data, cmap='plasma')

# Create a colorbar with custom ticks and labels
cbar = plt.colorbar(im, ticks=[0, 0.5, 1])
cbar.set_ticklabels(['Low', 'Medium', 'High'])
cbar.set_label('How2Matplotlib.com Categories')

plt.title('Colorbar with Custom Ticks and Labels')
plt.show()
Output:
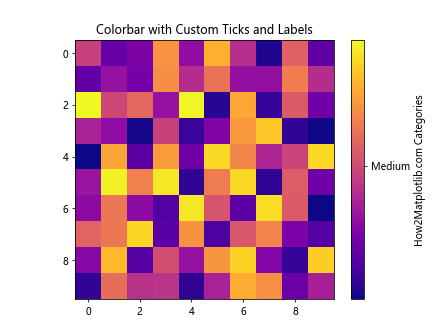
Here, we’ve set custom tick locations and replaced the numeric labels with categorical ones.
Advanced Techniques with Matplotlib.pyplot.colorbar()
As you become more comfortable with the basics of Matplotlib.pyplot.colorbar(), you can start exploring more advanced techniques to create even more impressive visualizations.
Multiple Colorbars in a Single Figure
Sometimes, you may need to display multiple colorbars in a single figure. Here’s how you can achieve this:
import matplotlib.pyplot as plt
import numpy as np

fig, (ax1, ax2) = plt.subplots(1, 2, figsize=(12, 5))

data1 = np.random.rand(10, 10)
data2 = np.random.randn(10, 10)

im1 = ax1.imshow(data1, cmap='viridis')
im2 = ax2.imshow(data2, cmap='coolwarm')

cbar1 = fig.colorbar(im1, ax=ax1, label='How2Matplotlib.com Data 1')
cbar2 = fig.colorbar(im2, ax=ax2, label='How2Matplotlib.com Data 2')

ax1.set_title('Plot 1')
ax2.set_title('Plot 2')

plt.tight_layout()
plt.show()
Output:
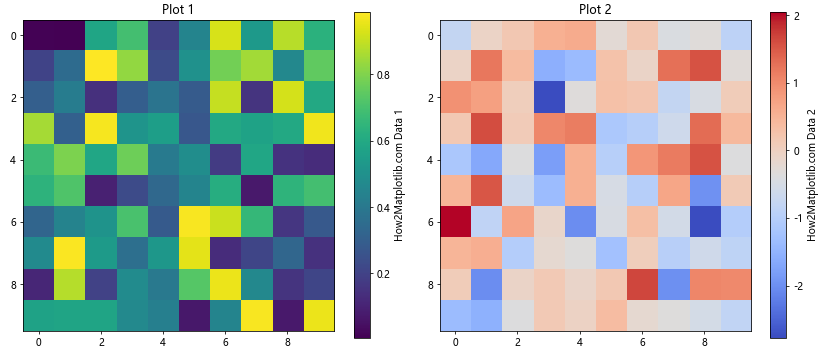
In this example, we create two subplots, each with its own colorbar. The ax parameter in the colorbar function specifies which axes the colorbar should be associated with.
Colorbar for Scatter Plots
Colorbars are not just for heatmaps and contour plots. They can also be very useful for scatter plots where points are colored based on a third variable:
import matplotlib.pyplot as plt
import numpy as np

x = np.random.rand(100)
y = np.random.rand(100)
colors = np.random.rand(100)

scatter = plt.scatter(x, y, c=colors, cmap='viridis')
plt.colorbar(scatter, label='How2Matplotlib.com Color Values')

plt.title('Scatter Plot with Colorbar')
plt.xlabel('X-axis')
plt.ylabel('Y-axis')
plt.show()
Output:
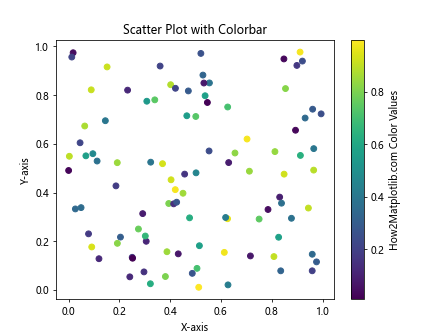
Here, we create a scatter plot where each point’s color is determined by a third variable. The colorbar helps interpret the meaning of these colors.
Fine-tuning Your Colorbar with Matplotlib.pyplot.colorbar()
To create truly professional-looking visualizations, you’ll want to fine-tune every aspect of your colorbar. Let’s explore some more advanced customization options:
Adjusting Colorbar Size and Position
You can precisely control the size and position of your colorbar:
import matplotlib.pyplot as plt
import numpy as np

data = np.random.rand(10, 10)

fig, ax = plt.subplots()
im = ax.imshow(data, cmap='YlOrRd')

# Create a colorbar with custom size and position
cbar = plt.colorbar(im, ax=ax, fraction=0.046, pad=0.04)
cbar.set_label('How2Matplotlib.com Values', rotation=270, labelpad=15)

plt.title('Colorbar with Custom Size and Position')
plt.show()
Output:
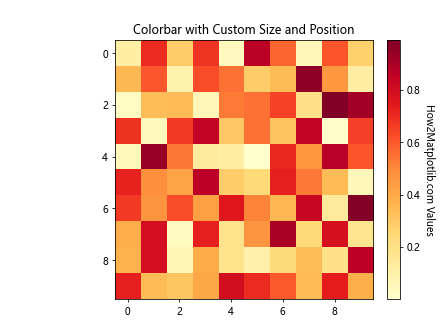
In this example, we use the fraction parameter to control the width of the colorbar relative to the main axes, and pad to adjust its distance from the main axes.
Creating a Discrete Colorbar
Sometimes, you may want to use a discrete colorbar instead of a continuous one:
import matplotlib.pyplot as plt
import numpy as np

data = np.random.randint(0, 5, (10, 10))

cmap = plt.cm.get_cmap('viridis', 5)  # 5 discrete colors
im = plt.imshow(data, cmap=cmap)

cbar = plt.colorbar(im, ticks=np.arange(5))
cbar.set_ticklabels(['Very Low', 'Low', 'Medium', 'High', 'Very High'])
cbar.set_label('How2Matplotlib.com Categories')

plt.title('Discrete Colorbar Example')
plt.show()
Output:
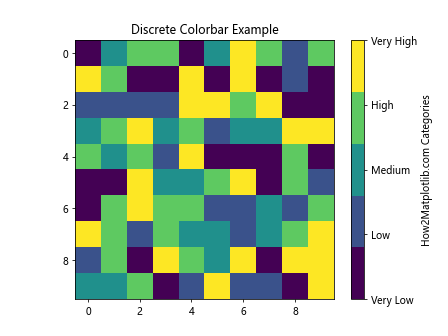
Here, we create a colormap with a specific number of discrete colors and use it to create a discrete colorbar.
Integrating Matplotlib.pyplot.colorbar() with Other Matplotlib Features
To truly master the Matplotlib.pyplot.colorbar() function, it’s important to understand how it interacts with other Matplotlib features. Let’s explore some of these interactions:
Colorbar with Logarithmic Scale
When dealing with data that spans several orders of magnitude, a logarithmic colorbar can be very useful:
import matplotlib.pyplot as plt
import numpy as np

data = np.random.lognormal(mean=0, sigma=1, size=(10, 10))

fig, ax = plt.subplots()
im = ax.imshow(data, norm=plt.LogNorm(), cmap='plasma')

cbar = plt.colorbar(im, label='How2Matplotlib.com Log Values')

plt.title('Logarithmic Colorbar Example')
plt.show()
In this example, we use plt.LogNorm() to create a logarithmic scale for our colorbar.
Colorbar with Custom Normalization
You can also create custom normalization for your colorbar:
import matplotlib.pyplot as plt
import numpy as np
from matplotlib.colors import Normalize

data = np.random.rand(10, 10)

class MidpointNormalize(Normalize):
    def __init__(self, vmin=None, vmax=None, midpoint=None, clip=False):
        self.midpoint = midpoint
        Normalize.__init__(self, vmin, vmax, clip)

    def __call__(self, value, clip=None):
        x, y = [self.vmin, self.midpoint, self.vmax], [0, 0.5, 1]
        return np.ma.masked_array(np.interp(value, x, y))

norm = MidpointNormalize(midpoint=0.5)
im = plt.imshow(data, norm=norm, cmap='RdYlBu_r')

cbar = plt.colorbar(im, label='How2Matplotlib.com Custom Norm')

plt.title('Colorbar with Custom Normalization')
plt.show()
Output:
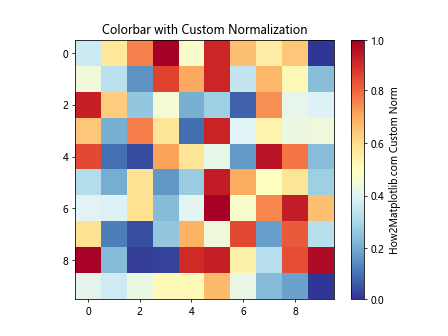
This example demonstrates how to create a custom normalization class that centers the colormap at a specific value.
Best Practices for Using Matplotlib.pyplot.colorbar()
To make the most of the Matplotlib.pyplot.colorbar() function, it’s important to follow some best practices:
- Always label your colorbar: Use the
labelparameter to clearly indicate what the colors represent. - Choose appropriate colormaps: Different colormaps are suitable for different types of data. For example, sequential colormaps like ‘viridis’ are good for continuous data, while diverging colormaps like ‘RdYlBu’ are better for data with a meaningful midpoint.
- Consider your audience: If your visualization will be printed in black and white, choose a colormap that will still be interpretable without color.
- Adjust the aspect ratio: Sometimes, you may need to adjust the aspect ratio of your plot to accommodate the colorbar without distorting the main visualization.
Here’s an example that incorporates these best practices:
import matplotlib.pyplot as plt
import numpy as np

data = np.random.randn(20, 20)

fig, ax = plt.subplots(figsize=(10, 8))
im = ax.imshow(data, cmap='RdYlBu', aspect='auto')

cbar = plt.colorbar(im, label='How2Matplotlib.com Temperature Anomaly (°C)')
cbar.set_ticks([-2, -1, 0, 1, 2])
cbar.set_ticklabels(['Very Cold', 'Cold', 'Normal', 'Warm', 'Very Warm'])

plt.title('Temperature Anomaly Map')
plt.tight_layout()
plt.show()
Output:
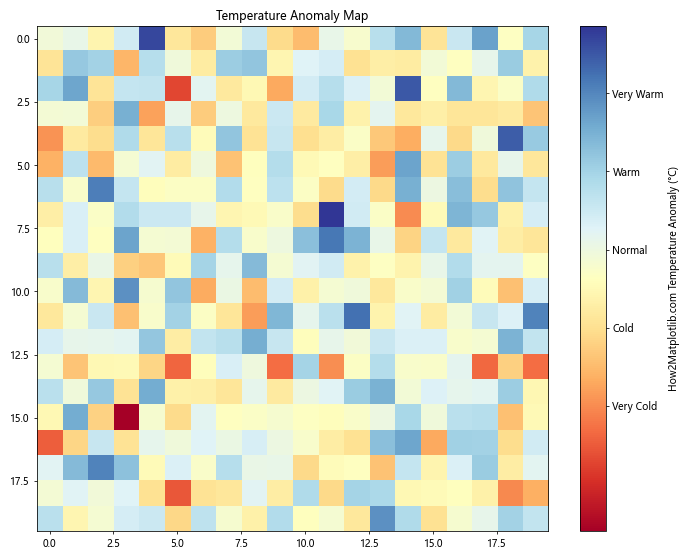
This example uses a diverging colormap suitable for temperature anomaly data, includes clear labels, and adjusts the figure size to accommodate the colorbar.
Troubleshooting Common Issues with Matplotlib.pyplot.colorbar()
Even experienced users can sometimes run into issues when working with the Matplotlib.pyplot.colorbar() function. Here are some common problems and their solutions:
Colorbar Not Showing Up
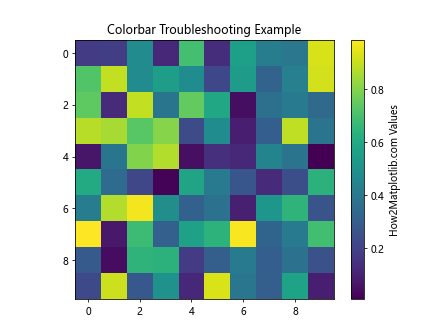
If your colorbar isn’t appearing, make sure you’re passing a mappable object to the colorbar function:
import matplotlib.pyplot as plt
import numpy as np

data = np.random.rand(10, 10)

fig, ax = plt.subplots()
im = ax.imshow(data)

# Correct way to add a colorbar
cbar = plt.colorbar(im, ax=ax, label='How2Matplotlib.com Values')

plt.title('Colorbar Troubleshooting Example')
plt.show()
Output:
Colorbar Range Not Matching Data
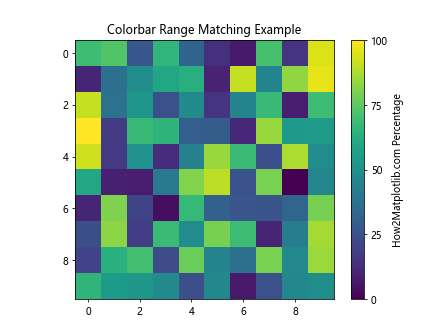
If your colorbar range doesn’t match your data, you might need to set the normalization manually:
import matplotlib.pyplot as plt
import numpy as np

data = np.random.rand(10, 10) * 100

fig, ax = plt.subplots()
im = ax.imshow(data, vmin=0, vmax=100)

cbar = plt.colorbar(im, ax=ax, label='How2Matplotlib.com Percentage')
cbar.set_ticks([0, 25, 50, 75, 100])

plt.title('Colorbar Range Matching Example')
plt.show()
Output:
Colorbar Ticks Not Aligning with Data
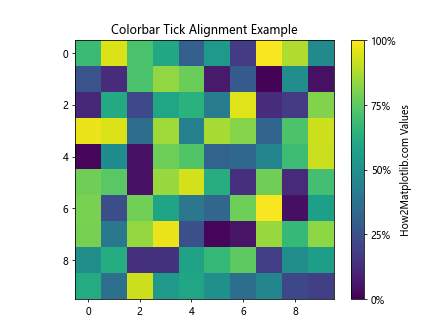
If your colorbar ticks aren’t aligning with your data, you may need to adjust them manually:
import matplotlib.pyplot as plt
import numpy as np

data = np.random.rand(10, 10)

fig, ax = plt.subplots()
im = ax.imshow(data, vmin=0, vmax=1)

cbar = plt.colorbar(im, ax=ax, label='How2Matplotlib.com Values')
cbar.set_ticks([0, 0.25, 0.5, 0.75, 1])
cbar.set_ticklabels(['0%', '25%', '50%', '75%', '100%'])

plt.title('Colorbar Tick Alignment Example')
plt.show()
Output:
Advanced Applications of Matplotlib.pyplot.colorbar()
As you become more proficient with the Matplotlib.pyplot.colorbar() function, you can start exploring more advanced applications. Here are a few examples to inspire you:
Colorbar for 3D Plots
You can use colorbars with 3D plots to represent an additional dimension of data:
import matplotlib.pyplot as plt
import numpy as np

fig = plt.figure(figsize=(10, 7))
ax = fig.add_subplot(111, projection='3d')

x = np.random.rand(100)
y = np.random.rand(100)
z = np.random.rand(100)
c = np.random.rand(100)

scatter = ax.scatter(x, y, z, c=c, cmap='viridis')

cbar = fig.colorbar(scatter, label='How2Matplotlib.com Values')

ax.set_xlabel('X-axis')
ax.set_ylabel('Y-axis')
ax.set_zlabel('Z-axis')
plt.title('3D Scatter Plot with Colorbar')
plt.show()
Output:
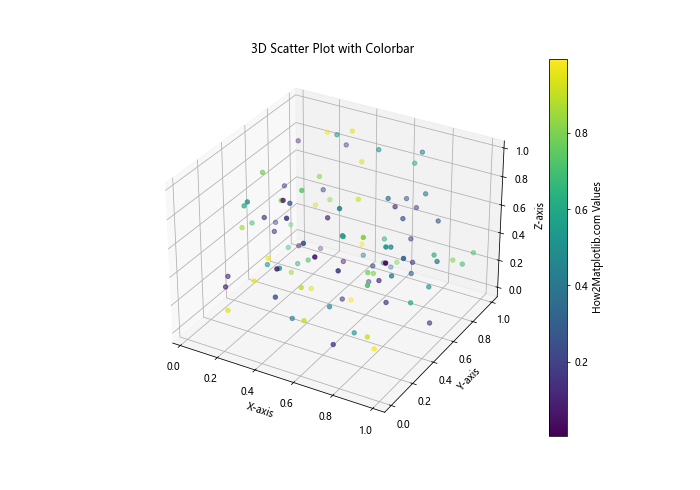
This example creates a 3D scatter plot where the color of each point represents a fourth dimension of data.
Colorbar for Animations
You can also use colorbars in animated plots:
import matplotlib.pyplot as plt
import numpy as np
from matplotlib.animation import FuncAnimation

fig, ax = plt.subplots()

def animate(frame):
    ax.clear()
    data = np.random.rand(10, 10) * frame
    im = ax.imshow(data, animated=True, cmap='plasma')
    if frame == 0:
        fig.colorbar(im, label='How2Matplotlib.com Values')
    plt.title(f'Frame {frame}')
    return [im]

anim = FuncAnimation(fig, animate, frames=20, interval=200, blit=True)
plt.show()
Output:
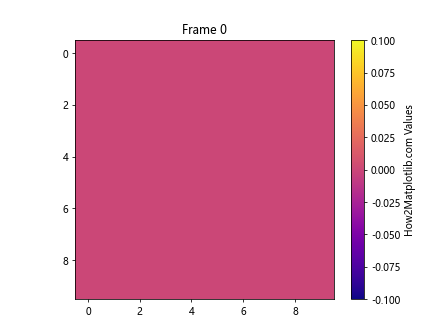
This example creates an animation where the data changes over time, but the colorbar remains constant.
Conclusion: Mastering Matplotlib.pyplot.colorbar()
The Matplotlib.pyplot.colorbar() function is a powerful tool for enhancing your data visualizations. By adding a colorbar to your plots, you can convey additional information and make your visualizations more informative and easier to interpret.
Throughout this comprehensive guide, we’ve explored the basics of using Matplotlib.pyplot.colorbar(), delved into customization options, discussed best practices, and even looked at some advanced applications. We’ve seen how to create basic colorbars, customize their appearance, integrate them with various types of plots, and troubleshoot common issues.
Remember, the key to mastering Matplotlib.pyplot.colorbar() is practice and experimentation. Don’t be afraid to try different options and combinations to find what works best for your specific data and visualization needs.
Here are some final tips to keep in mind when working with Matplotlib.pyplot.colorbar():
- Always consider the nature of your data when choosing a colormap and colorbar style.
- Use clear and descriptive labels for your colorbars to ensure your visualizations are easily understood.
- Pay attention to the alignment and positioning of your colorbar to create a balanced and aesthetically pleasing plot.
- Experiment with different normalization techniques to best represent your data.
- Consider accessibility when choosing colors, ensuring your visualizations are interpretable by individuals with color vision deficiencies.
Let’s conclude with one final example that incorporates many of the concepts we’ve discussed:
import matplotlib.pyplot as plt
import numpy as np
from mpl_toolkits.axes_grid1 import make_axes_locatable

# Generate sample data
x = np.linspace(-3, 3, 100)
y = np.linspace(-3, 3, 100)
X, Y = np.meshgrid(x, y)
Z = np.sin(X) * np.cos(Y)

# Create the main plot
fig, ax = plt.subplots(figsize=(10, 8))
im = ax.imshow(Z, cmap='RdYlBu_r', extent=[-3, 3, -3, 3])

# Create a divider for the existing axes instance
divider = make_axes_locatable(ax)

# Append axes to the right of the main axes, with 2% width of the main axes
cax = divider.append_axes("right", size="2%", pad=0.1)

# Create the colorbar in the appended axes
cbar = plt.colorbar(im, cax=cax)

# Customize the colorbar
cbar.set_label('How2Matplotlib.com Sin(X) * Cos(Y)', rotation=270, labelpad=15)
cbar.set_ticks([-1, -0.5, 0, 0.5, 1])
cbar.set_ticklabels(['Low', 'Medium-Low', 'Neutral', 'Medium-High', 'High'])

# Add contour lines
contours = ax.contour(X, Y, Z, colors='black', alpha=0.3)
ax.clabel(contours, inline=True, fontsize=8)

# Set title and labels
ax.set_title('Advanced Colorbar Example: Sin(X) * Cos(Y)')
ax.set_xlabel('X-axis')
ax.set_ylabel('Y-axis')

plt.tight_layout()
plt.show()
Output:
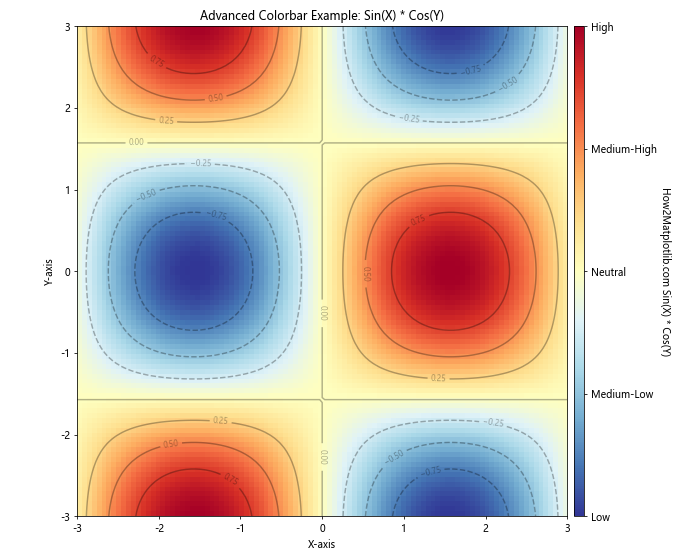
This final example demonstrates a more complex visualization that incorporates many of the techniques we’ve discussed. It includes a custom-positioned colorbar with tailored labels, contour lines overlaid on a heatmap, and careful attention to layout and labeling.