Comprehensive Guide to Using matplotlib.pyplot.clabel() in Python for Data Visualization
matplotlib.pyplot.clabel() is a powerful function in Python’s Matplotlib library that allows you to add contour labels to contour plots. This function is essential for enhancing the readability and interpretability of contour plots, making it easier for viewers to understand the values represented by different contour lines. In this comprehensive guide, we’ll explore the various aspects of matplotlib.pyplot.clabel(), including its syntax, parameters, and practical applications in data visualization.
Understanding the Basics of matplotlib.pyplot.clabel()
matplotlib.pyplot.clabel() is primarily used in conjunction with contour plots created by the contour() or contourf() functions. It adds labels to contour lines, providing numerical values or custom text to indicate the level of each contour. This function is particularly useful when working with scientific data, topographical maps, or any visualization that requires clear identification of contour levels.
Let’s start with a basic example to illustrate how matplotlib.pyplot.clabel() works:
import numpy as np
import matplotlib.pyplot as plt

# Generate sample data
x = np.linspace(-5, 5, 100)
y = np.linspace(-5, 5, 100)
X, Y = np.meshgrid(x, y)
Z = np.sin(np.sqrt(X**2 + Y**2))

# Create a contour plot
fig, ax = plt.subplots()
CS = ax.contour(X, Y, Z)

# Add labels to the contour lines
ax.clabel(CS, inline=True, fontsize=10)

plt.title('Basic Contour Plot with Labels - how2matplotlib.com')
plt.show()
Output:
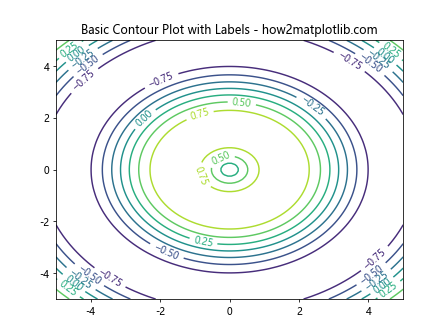
In this example, we create a simple contour plot of a 2D sine function and use matplotlib.pyplot.clabel() to add labels to the contour lines. The ‘inline=True’ parameter ensures that the labels are placed along the contour lines, and ‘fontsize=10’ sets the size of the label text.
Customizing Label Appearance with matplotlib.pyplot.clabel()
matplotlib.pyplot.clabel() offers various parameters to customize the appearance of contour labels. Let’s explore some of these options:
Formatting Label Text
You can control the format of the label text using the ‘fmt’ parameter:
import numpy as np
import matplotlib.pyplot as plt

x = np.linspace(-5, 5, 100)
y = np.linspace(-5, 5, 100)
X, Y = np.meshgrid(x, y)
Z = np.sin(np.sqrt(X**2 + Y**2))

fig, ax = plt.subplots()
CS = ax.contour(X, Y, Z)

# Format labels to display two decimal places
ax.clabel(CS, inline=True, fmt='%.2f')

plt.title('Formatted Contour Labels - how2matplotlib.com')
plt.show()
Output:
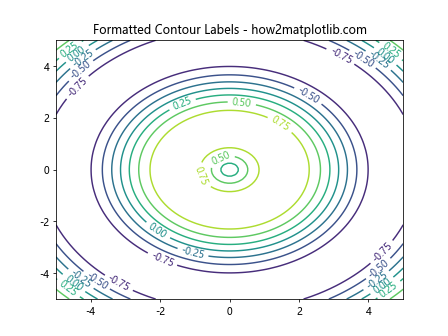
This example formats the labels to display two decimal places.
Changing Label Colors
You can set the color of the labels using the ‘colors’ parameter:
import numpy as np
import matplotlib.pyplot as plt

x = np.linspace(-5, 5, 100)
y = np.linspace(-5, 5, 100)
X, Y = np.meshgrid(x, y)
Z = np.sin(np.sqrt(X**2 + Y**2))

fig, ax = plt.subplots()
CS = ax.contour(X, Y, Z)

# Set label color to red
ax.clabel(CS, inline=True, colors='red')

plt.title('Colored Contour Labels - how2matplotlib.com')
plt.show()
Output:
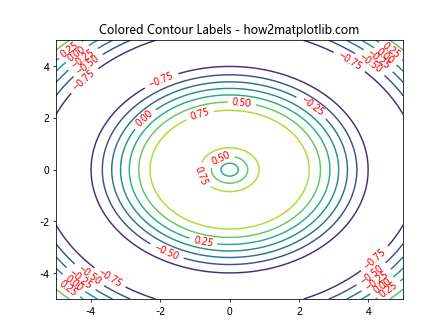
This example sets the label color to red.
Advanced Techniques with matplotlib.pyplot.clabel()
Now that we’ve covered the basics, let’s explore some more advanced techniques using matplotlib.pyplot.clabel().
Selective Labeling
You can choose to label only specific contour levels:
import numpy as np
import matplotlib.pyplot as plt

x = np.linspace(-5, 5, 100)
y = np.linspace(-5, 5, 100)
X, Y = np.meshgrid(x, y)
Z = np.sin(np.sqrt(X**2 + Y**2))

fig, ax = plt.subplots()
CS = ax.contour(X, Y, Z)

# Label only specific levels
ax.clabel(CS, inline=True, levels=[-0.5, 0, 0.5])

plt.title('Selective Contour Labeling - how2matplotlib.com')
plt.show()
Output:
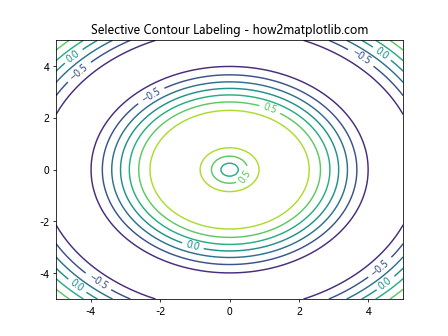
This example labels only the contour lines at levels -0.5, 0, and 0.5.
Manual Placement of Labels
For more precise control, you can manually specify the positions of labels:
import numpy as np
import matplotlib.pyplot as plt

x = np.linspace(-5, 5, 100)
y = np.linspace(-5, 5, 100)
X, Y = np.meshgrid(x, y)
Z = np.sin(np.sqrt(X**2 + Y**2))

fig, ax = plt.subplots()
CS = ax.contour(X, Y, Z)

# Manually place labels
manual_locations = [(-1, 1), (1, -1), (2, 2)]
ax.clabel(CS, inline=True, manual=manual_locations)

plt.title('Manual Label Placement - how2matplotlib.com')
plt.show()
Output:
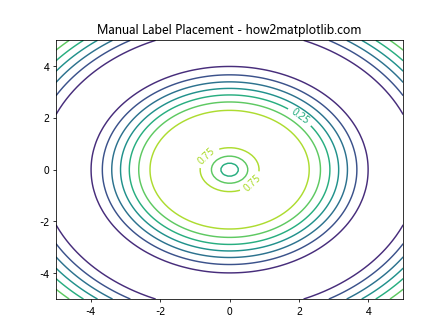
This example demonstrates how to manually place labels at specific coordinates.
Integrating matplotlib.pyplot.clabel() with Other Plot Types
matplotlib.pyplot.clabel() can be used in combination with other types of plots to create more informative visualizations.
Combining with Filled Contours
You can use clabel() with filled contour plots:
import numpy as np
import matplotlib.pyplot as plt

x = np.linspace(-5, 5, 100)
y = np.linspace(-5, 5, 100)
X, Y = np.meshgrid(x, y)
Z = np.sin(np.sqrt(X**2 + Y**2))

fig, ax = plt.subplots()
CS = ax.contourf(X, Y, Z)
CS2 = ax.contour(X, Y, Z, colors='black')
ax.clabel(CS2, inline=True, fontsize=8)

plt.title('Labeled Contours with Filled Contour Plot - how2matplotlib.com')
plt.colorbar(CS)
plt.show()
Output:
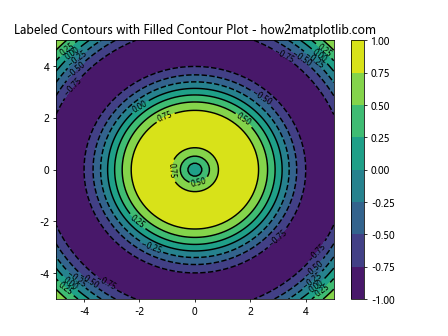
This example combines a filled contour plot with labeled contour lines.
Adding Labels to 3D Contour Plots
matplotlib.pyplot.clabel() can also be used with 3D contour plots:
import numpy as np
import matplotlib.pyplot as plt
from mpl_toolkits.mplot3d import Axes3D

x = np.linspace(-5, 5, 100)
y = np.linspace(-5, 5, 100)
X, Y = np.meshgrid(x, y)
Z = np.sin(np.sqrt(X**2 + Y**2))

fig = plt.figure()
ax = fig.add_subplot(111, projection='3d')
CS = ax.contour(X, Y, Z)
ax.clabel(CS, inline=True, fontsize=8)

plt.title('3D Contour Plot with Labels - how2matplotlib.com')
plt.show()
Output:
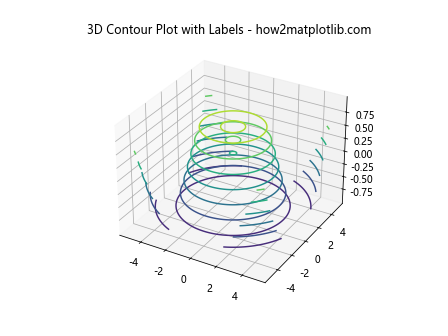
This example demonstrates how to add labels to a 3D contour plot.
Handling Special Cases with matplotlib.pyplot.clabel()
There are certain situations where using matplotlib.pyplot.clabel() requires special consideration.
Dealing with Sparse Data
When working with sparse data, you might need to adjust the labeling:
import numpy as np
import matplotlib.pyplot as plt

x = np.linspace(-5, 5, 20)
y = np.linspace(-5, 5, 20)
X, Y = np.meshgrid(x, y)
Z = np.sin(np.sqrt(X**2 + Y**2))

fig, ax = plt.subplots()
CS = ax.contour(X, Y, Z)
ax.clabel(CS, inline=True, fontsize=8, use_clabeltext=True)

plt.title('Contour Labels with Sparse Data - how2matplotlib.com')
plt.show()
Output:
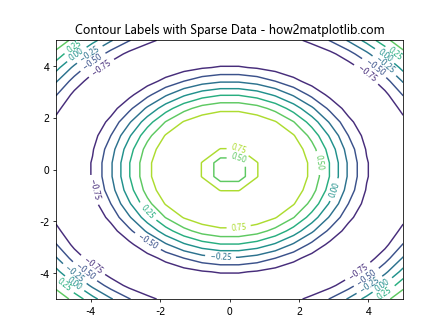
The ‘use_clabeltext=True’ parameter can help improve label placement in sparse data situations.
Handling Overlapping Labels
When dealing with dense contours, labels may overlap. You can use the ‘inline_spacing’ parameter to adjust this:
import numpy as np
import matplotlib.pyplot as plt

x = np.linspace(-5, 5, 100)
y = np.linspace(-5, 5, 100)
X, Y = np.meshgrid(x, y)
Z = np.sin(np.sqrt(X**2 + Y**2)) + np.cos(np.sqrt(X**2 + Y**2))

fig, ax = plt.subplots()
CS = ax.contour(X, Y, Z, levels=20)
ax.clabel(CS, inline=True, fontsize=8, inline_spacing=10)

plt.title('Handling Overlapping Labels - how2matplotlib.com')
plt.show()
Output:
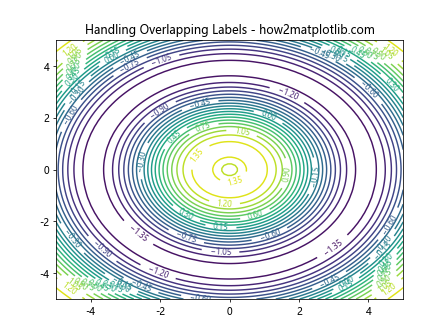
This example increases the inline spacing to reduce label overlap in a dense contour plot.
Best Practices for Using matplotlib.pyplot.clabel()
To make the most of matplotlib.pyplot.clabel(), consider the following best practices:
- Choose appropriate contour levels: Select levels that highlight important features in your data.
- Use clear formatting: Ensure that your labels are easily readable and not cluttered.
- Consider color contrast: Make sure your labels are visible against the background of your plot.
- Adjust label density: Use the ‘inline_spacing’ parameter to control label density and avoid overcrowding.
- Combine with other plot elements: Use clabel() in conjunction with colorbars and legends for comprehensive visualizations.
Let’s implement these best practices in an example:
import numpy as np
import matplotlib.pyplot as plt

x = np.linspace(-5, 5, 100)
y = np.linspace(-5, 5, 100)
X, Y = np.meshgrid(x, y)
Z = np.sin(np.sqrt(X**2 + Y**2)) * np.exp(-0.1 * (X**2 + Y**2))

fig, ax = plt.subplots(figsize=(10, 8))
levels = np.linspace(Z.min(), Z.max(), 10)
CS = ax.contourf(X, Y, Z, levels=levels, cmap='viridis')
CS2 = ax.contour(X, Y, Z, levels=levels, colors='white', linewidths=0.5)
ax.clabel(CS2, inline=True, fontsize=8, fmt='%.2f', colors='white', inline_spacing=10)

plt.colorbar(CS)
plt.title('Best Practices for Contour Labeling - how2matplotlib.com')
plt.show()
Output:
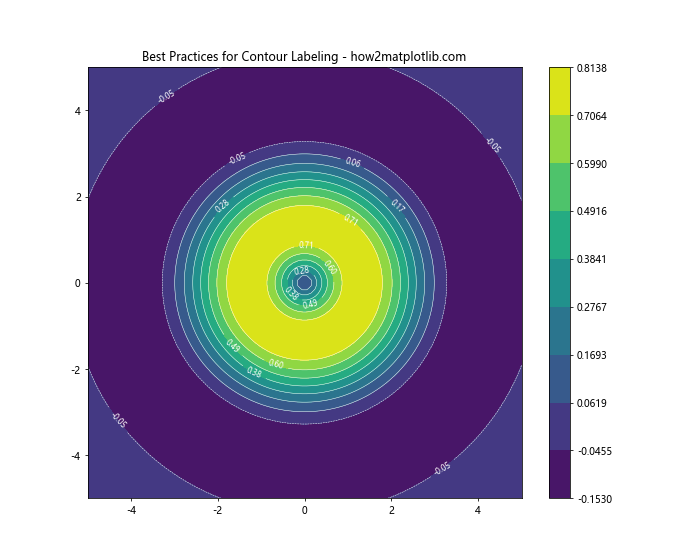
This example demonstrates best practices by using appropriate contour levels, clear formatting, good color contrast, and adjusted label density.
Troubleshooting Common Issues with matplotlib.pyplot.clabel()
When using matplotlib.pyplot.clabel(), you might encounter some common issues. Here are some problems and their solutions:
Labels Not Appearing
If your labels are not appearing, check the following:
- Ensure that your contour plot is actually created before calling clabel().
- Verify that your data has sufficient variation to create visible contours.
Here’s an example that addresses these issues:
import numpy as np
import matplotlib.pyplot as plt

x = np.linspace(-5, 5, 100)
y = np.linspace(-5, 5, 100)
X, Y = np.meshgrid(x, y)
Z = np.sin(np.sqrt(X**2 + Y**2))

fig, ax = plt.subplots()
CS = ax.contour(X, Y, Z)
if len(CS.collections) > 0:
    ax.clabel(CS, inline=True, fontsize=8)
else:
    print("No contours to label")

plt.title('Ensuring Labels Appear - how2matplotlib.com')
plt.show()
Output:
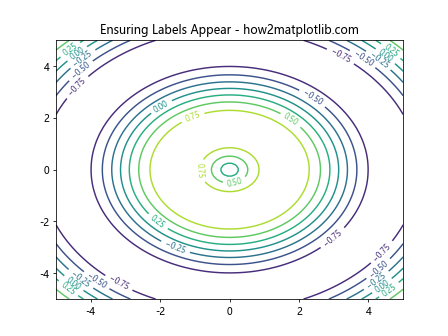
This example checks if contours are created before attempting to label them.
Incorrect Label Positions
If your labels are not positioned correctly, try adjusting the ‘inline’ and ‘inline_spacing’ parameters:
import numpy as np
import matplotlib.pyplot as plt

x = np.linspace(-5, 5, 100)
y = np.linspace(-5, 5, 100)
X, Y = np.meshgrid(x, y)
Z = np.sin(np.sqrt(X**2 + Y**2))

fig, ax = plt.subplots()
CS = ax.contour(X, Y, Z)
ax.clabel(CS, inline=True, fontsize=8, inline_spacing=15)

plt.title('Adjusting Label Positions - how2matplotlib.com')
plt.show()
Output:
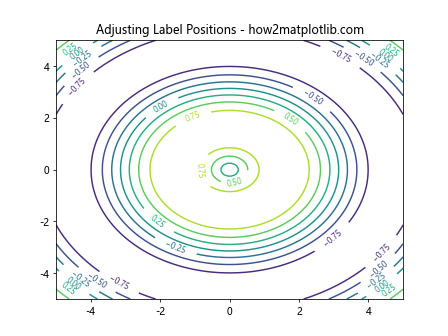
This example increases the inline spacing to improve label positioning.
Advanced Applications of matplotlib.pyplot.clabel()
matplotlib.pyplot.clabel() can be used in more complex scenarios for advanced data visualization.
Labeling Multiple Contour Sets
You can label multiple contour sets in the same plot:
import numpy as np
import matplotlib.pyplot as plt

x = np.linspace(-5, 5, 100)
y = np.linspace(-5, 5, 100)
X, Y = np.meshgrid(x, y)
Z1 = np.sin(np.sqrt(X**2 + Y**2))
Z2 = np.cos(np.sqrt(X**2 + Y**2))

fig, ax = plt.subplots()
CS1 = ax.contour(X, Y, Z1, colors='red')
CS2 = ax.contour(X, Y, Z2, colors='blue')
ax.clabel(CS1, inline=True, fontsize=8, colors='red')
ax.clabel(CS2, inline=True, fontsize=8, colors='blue')

plt.title('Labeling Multiple Contour Sets - how2matplotlib.com')
plt.show()
Output:
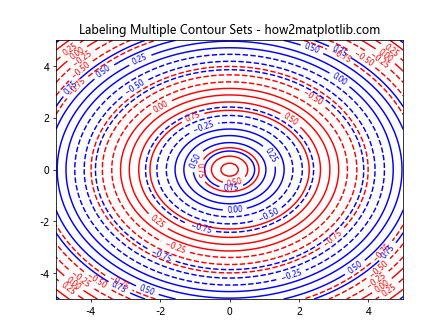
This example labels two different contour sets with different colors.
Custom Label Formatting
You can use a custom function to format your labels:
import numpy as np
import matplotlib.pyplot as plt

def custom_formatter(x):
    return f'Value: {x:.2f}'

x = np.linspace(-5, 5, 100)
y = np.linspace(-5, 5, 100)
X, Y = np.meshgrid(x, y)
Z = np.sin(np.sqrt(X**2 + Y**2))

fig, ax = plt.subplots()
CS = ax.contour(X, Y, Z)
ax.clabel(CS, inline=True, fontsize=8, fmt=custom_formatter)

plt.title('Custom Label Formatting - how2matplotlib.com')
plt.show()
Output:
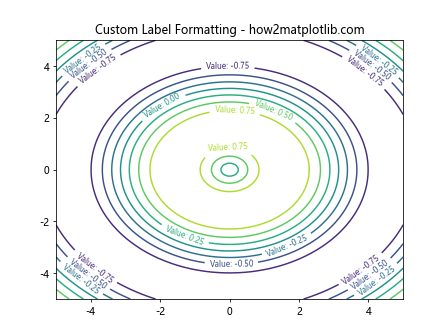
This example uses a custom function to format the contour labels.
Comparing matplotlib.pyplot.clabel() with Other Labeling Methods
While matplotlib.pyplot.clabel() is a powerful tool for labeling contours, it’s worth comparing it with other labeling methods to understand its strengths and limitations.
Manual Text Annotations
Sometimes, you might want more control over label placement than clabel() provides. In such cases, you can use manual text annotations:
import numpy as np
import matplotlib.pyplot as plt

x = np.linspace(-5, 5, 100)
y = np.linspace(-5, 5, 100)
X, Y = np.meshgrid(x, y)
Z = np.sin(np.sqrt(X**2 + Y**2))

fig, ax = plt.subplots()
CS = ax.contour(X, Y, Z)
manual_locations = [(-2, 2), (2,2), (0, -3)]
for loc, level in zip(manual_locations, CS.levels):
    ax.annotate(f'{level:.2f}', xy=loc, xytext=(3, 3), textcoords='offset points')

plt.title('Manual Text Annotations vs clabel() - how2matplotlib.com')
plt.show()
Output:
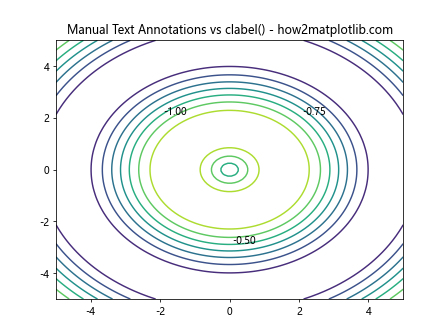
This example demonstrates how to use manual text annotations instead of clabel().
Using Colorbar with Contour Plot
Another alternative to using clabel() is to rely on a colorbar to indicate contour levels:
import numpy as np
import matplotlib.pyplot as plt

x = np.linspace(-5, 5, 100)
y = np.linspace(-5, 5, 100)
X, Y = np.meshgrid(x, y)
Z = np.sin(np.sqrt(X**2 + Y**2))

fig, ax = plt.subplots()
CS = ax.contourf(X, Y, Z, levels=20, cmap='viridis')
plt.colorbar(CS)

plt.title('Using Colorbar Instead of clabel() - how2matplotlib.com')
plt.show()
Output:
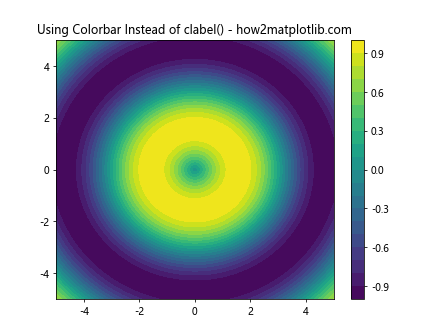
This example uses a colorbar instead of direct labels on the contour lines.
Optimizing Performance with matplotlib.pyplot.clabel()
When working with large datasets or creating multiple plots, optimizing the performance of matplotlib.pyplot.clabel() can be crucial.
Reducing the Number of Labels
One way to improve performance is to reduce the number of labels:
import numpy as np
import matplotlib.pyplot as plt

x = np.linspace(-5, 5, 200)
y = np.linspace(-5, 5, 200)
X, Y = np.meshgrid(x, y)
Z = np.sin(np.sqrt(X**2 + Y**2))

fig, ax = plt.subplots()
CS = ax.contour(X, Y, Z)
ax.clabel(CS, inline=True, fontsize=8, levels=np.linspace(-1, 1, 5))

plt.title('Optimized Labeling with Fewer Labels - how2matplotlib.com')
plt.show()
Output:
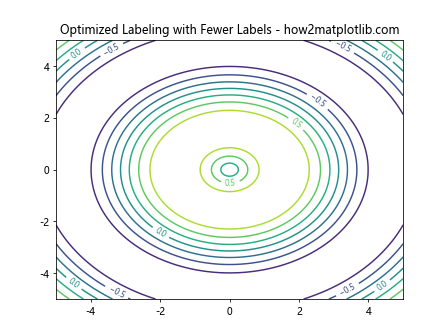
This example reduces the number of labeled levels to improve performance.
Using the ‘use_clabeltext’ Parameter
The ‘use_clabeltext’ parameter can sometimes improve performance, especially for large plots:
import numpy as np
import matplotlib.pyplot as plt

x = np.linspace(-5, 5, 200)
y = np.linspace(-5, 5, 200)
X, Y = np.meshgrid(x, y)
Z = np.sin(np.sqrt(X**2 + Y**2))

fig, ax = plt.subplots()
CS = ax.contour(X, Y, Z)
ax.clabel(CS, inline=True, fontsize=8, use_clabeltext=True)

plt.title('Using use_clabeltext for Performance - how2matplotlib.com')
plt.show()
Output:
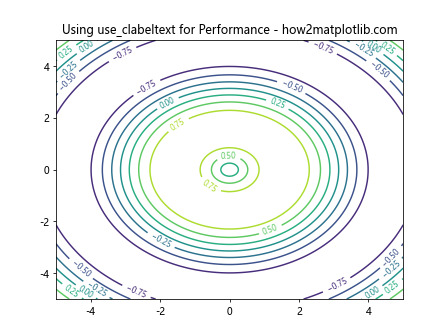
This example uses the ‘use_clabeltext’ parameter, which can be more efficient for certain types of plots.
Integrating matplotlib.pyplot.clabel() with Real-World Data
Let’s explore how to use matplotlib.pyplot.clabel() with real-world data scenarios.
Weather Map Visualization
Here’s an example of using clabel() to create a simple weather map:
import numpy as np
import matplotlib.pyplot as plt

# Simulated temperature data
lat = np.linspace(30, 50, 50)
lon = np.linspace(-120, -70, 60)
LON, LAT = np.meshgrid(lon, lat)
TEMP = 15 + 8 * np.sin((LON + LAT) / 10) + np.random.randn(50, 60)

fig, ax = plt.subplots(figsize=(12, 8))
CS = ax.contourf(LON, LAT, TEMP, levels=15, cmap='RdYlBu_r')
CS2 = ax.contour(LON, LAT, TEMP, levels=15, colors='black', linewidths=0.5)
ax.clabel(CS2, inline=True, fontsize=8, fmt='%.1f°C')

plt.colorbar(CS)
plt.title('Weather Map with Temperature Contours - how2matplotlib.com')
plt.xlabel('Longitude')
plt.ylabel('Latitude')
plt.show()
Output:
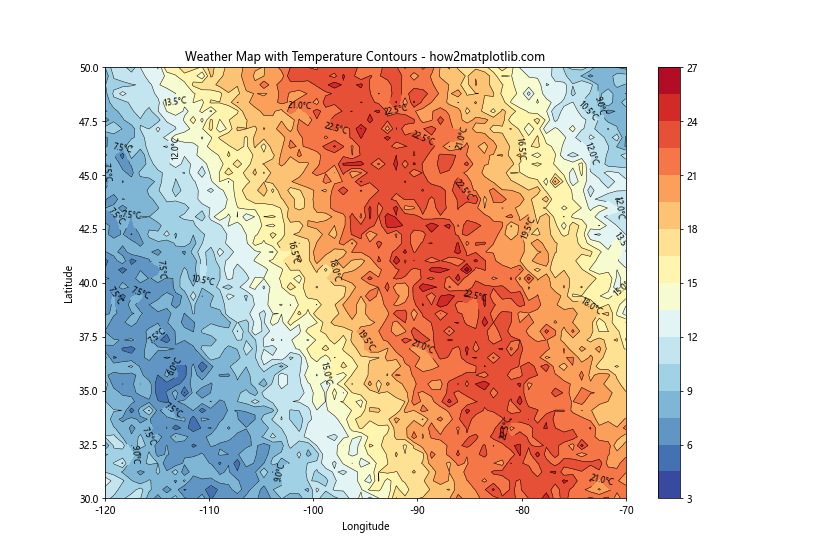
This example simulates a weather map with temperature contours and labels.
Topographical Map
Here’s how you might use clabel() to create a topographical map:
import numpy as np
import matplotlib.pyplot as plt

# Simulated elevation data
x = np.linspace(0, 10, 100)
y = np.linspace(0, 10, 100)
X, Y = np.meshgrid(x, y)
Z = 2000 + 500 * np.sin(X) + 500 * np.cos(Y) + 200 * np.random.randn(100, 100)

fig, ax = plt.subplots(figsize=(10, 8))
levels = np.arange(1500, 3500, 100)
CS = ax.contourf(X, Y, Z, levels=levels, cmap='terrain')
CS2 = ax.contour(X, Y, Z, levels=levels, colors='black', linewidths=0.5)
ax.clabel(CS2, inline=True, fontsize=8, fmt='%d m')

plt.colorbar(CS)
plt.title('Topographical Map with Elevation Contours - how2matplotlib.com')
plt.xlabel('Distance (km)')
plt.ylabel('Distance (km)')
plt.show()
Output:
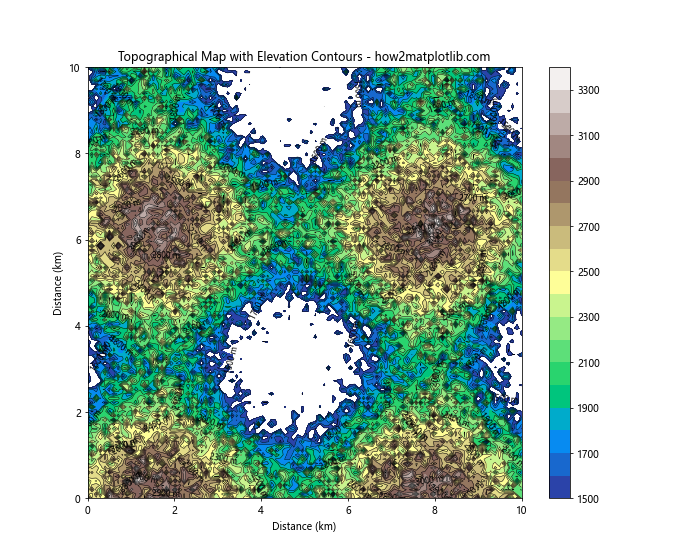
This example creates a simulated topographical map with elevation contours and labels.
Conclusion
matplotlib.pyplot.clabel() is a versatile and powerful function for adding informative labels to contour plots in Python. Throughout this comprehensive guide, we’ve explored its basic usage, advanced techniques, integration with other plot types, troubleshooting common issues, and real-world applications. By mastering the use of clabel(), you can create more informative and visually appealing contour plots for a wide range of data visualization tasks.