Comprehensive Guide to Using Matplotlib.pyplot.barh() Function in Python for Data Visualization
Matplotlib.pyplot.barh() function in Python is a powerful tool for creating horizontal bar charts. This function is part of the Matplotlib library, which is widely used for data visualization in Python. In this comprehensive guide, we’ll explore the Matplotlib.pyplot.barh() function in depth, covering its syntax, parameters, and various use cases. We’ll also provide numerous examples to illustrate how to create effective and visually appealing horizontal bar charts using this function.
Understanding the Basics of Matplotlib.pyplot.barh()
The Matplotlib.pyplot.barh() function is specifically designed to create horizontal bar charts. These charts are particularly useful when you have categorical data with long labels or when you want to compare values across different categories. The horizontal orientation of the bars makes it easier to read and compare values, especially when dealing with a large number of categories.
Let’s start with a basic example to understand how the Matplotlib.pyplot.barh() function works:
import matplotlib.pyplot as plt

categories = ['Category A', 'Category B', 'Category C', 'Category D']
values = [25, 40, 30, 55]

plt.figure(figsize=(10, 6))
plt.barh(categories, values)
plt.title('Basic Horizontal Bar Chart - how2matplotlib.com')
plt.xlabel('Values')
plt.ylabel('Categories')
plt.show()
Output:
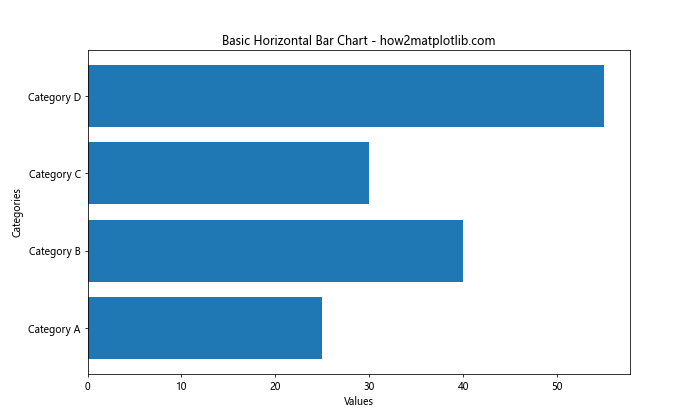
In this example, we import the Matplotlib.pyplot module and create two lists: one for categories and another for their corresponding values. We then use the plt.barh() function to create a horizontal bar chart. The first argument is the list of categories, and the second argument is the list of values. We also set a title, x-label, and y-label to make the chart more informative.
Customizing Matplotlib.pyplot.barh() Charts
The Matplotlib.pyplot.barh() function offers various parameters to customize the appearance of your horizontal bar charts. Let’s explore some of these customization options:
Changing Bar Colors
You can easily change the color of the bars using the ‘color’ parameter:
import matplotlib.pyplot as plt

categories = ['Product A', 'Product B', 'Product C', 'Product D']
sales = [1500, 1200, 1800, 1000]

plt.figure(figsize=(10, 6))
plt.barh(categories, sales, color='skyblue')
plt.title('Product Sales - how2matplotlib.com')
plt.xlabel('Sales ($)')
plt.ylabel('Products')
plt.show()
Output:
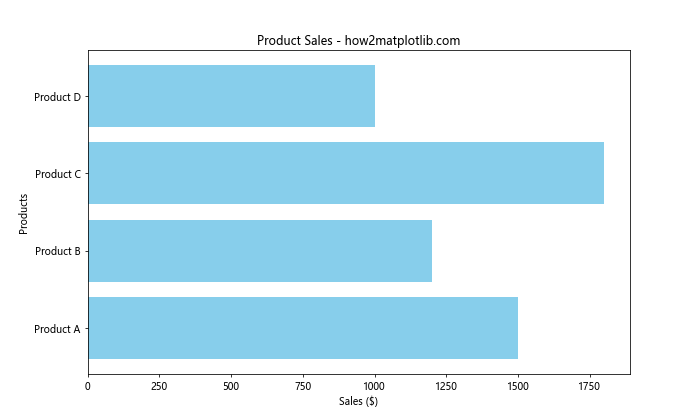
In this example, we set the color of all bars to ‘skyblue’. You can use any valid color name or hexadecimal color code.
Adding Error Bars
The Matplotlib.pyplot.barh() function allows you to add error bars to your horizontal bar chart:
import matplotlib.pyplot as plt
import numpy as np

categories = ['Category X', 'Category Y', 'Category Z']
values = [75, 60, 80]
errors = [5, 3, 7]

plt.figure(figsize=(10, 6))
plt.barh(categories, values, xerr=errors, capsize=5)
plt.title('Horizontal Bar Chart with Error Bars - how2matplotlib.com')
plt.xlabel('Values')
plt.ylabel('Categories')
plt.show()
Output:
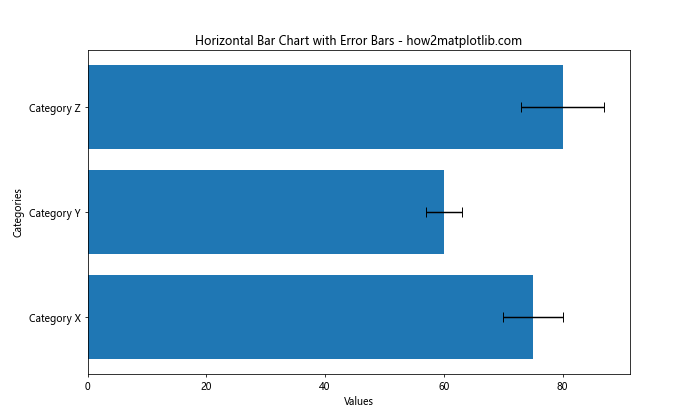
Here, we use the ‘xerr’ parameter to specify the error values for each bar. The ‘capsize’ parameter sets the width of the error bar caps.
Customizing Bar Width
You can adjust the width of the bars using the ‘height’ parameter:
import matplotlib.pyplot as plt

categories = ['Group 1', 'Group 2', 'Group 3', 'Group 4']
values = [30, 45, 25, 60]

plt.figure(figsize=(10, 6))
plt.barh(categories, values, height=0.5)
plt.title('Customized Bar Width - how2matplotlib.com')
plt.xlabel('Values')
plt.ylabel('Groups')
plt.show()
Output:
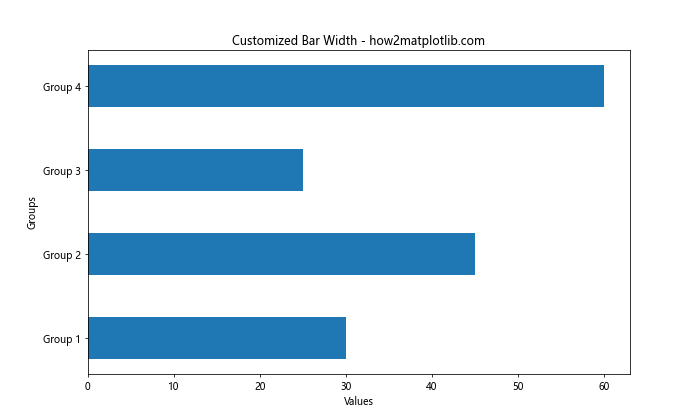
In this example, we set the ‘height’ parameter to 0.5, which makes the bars thinner than the default width.
Advanced Techniques with Matplotlib.pyplot.barh()
Now that we’ve covered the basics, let’s explore some more advanced techniques using the Matplotlib.pyplot.barh() function:
Creating Stacked Horizontal Bar Charts
Stacked horizontal bar charts are useful for showing the composition of different categories:
import matplotlib.pyplot as plt

categories = ['Category A', 'Category B', 'Category C']
values1 = [20, 35, 30]
values2 = [25, 25, 15]
values3 = [15, 15, 25]

plt.figure(figsize=(10, 6))
plt.barh(categories, values1, label='Group 1')
plt.barh(categories, values2, left=values1, label='Group 2')
plt.barh(categories, values3, left=[i+j for i,j in zip(values1, values2)], label='Group 3')

plt.title('Stacked Horizontal Bar Chart - how2matplotlib.com')
plt.xlabel('Values')
plt.ylabel('Categories')
plt.legend()
plt.show()
Output:
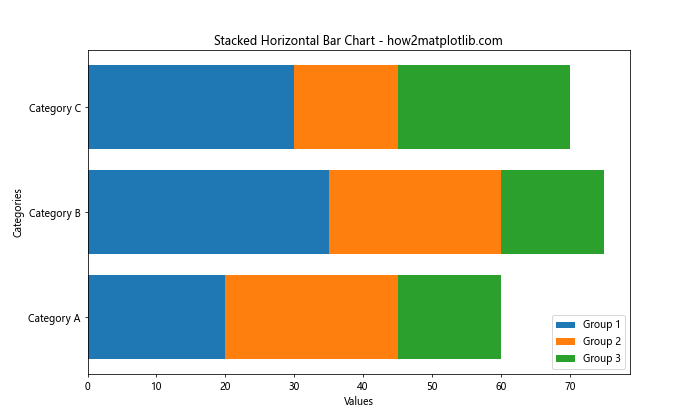
In this example, we create three sets of values and stack them using the ‘left’ parameter to specify the starting point of each bar segment.
Creating Grouped Horizontal Bar Charts
Grouped horizontal bar charts are useful for comparing multiple variables across categories:
import matplotlib.pyplot as plt
import numpy as np

categories = ['Category X', 'Category Y', 'Category Z']
men_scores = [20, 35, 30]
women_scores = [25, 32, 34]

x = np.arange(len(categories))
width = 0.35

fig, ax = plt.subplots(figsize=(10, 6))
ax.barh(x - width/2, men_scores, width, label='Men')
ax.barh(x + width/2, women_scores, width, label='Women')

ax.set_yticks(x)
ax.set_yticklabels(categories)
ax.legend()

plt.title('Grouped Horizontal Bar Chart - how2matplotlib.com')
plt.xlabel('Scores')
plt.show()
Output:
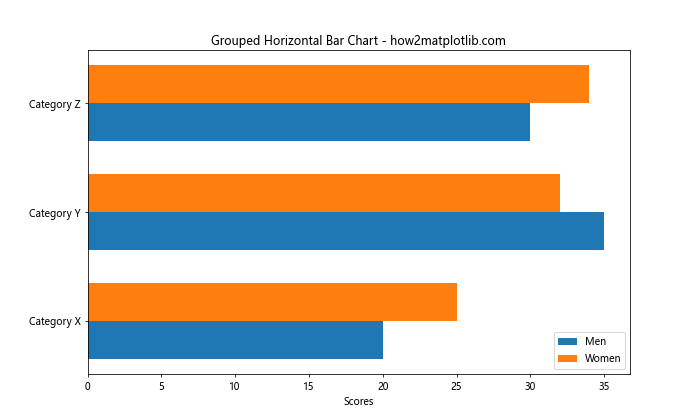
This example creates two groups of bars side by side for each category, allowing for easy comparison between men’s and women’s scores.
Adding Data Labels to Bars
Adding data labels to your bars can make your chart more informative:
import matplotlib.pyplot as plt

categories = ['Product A', 'Product B', 'Product C', 'Product D']
sales = [1500, 1200, 1800, 1000]

fig, ax = plt.subplots(figsize=(10, 6))
bars = ax.barh(categories, sales)

ax.set_xlabel('Sales ($)')
ax.set_title('Product Sales with Data Labels - how2matplotlib.com')

for bar in bars:
    width = bar.get_width()
    ax.text(width, bar.get_y() + bar.get_height()/2, f'${width}',
            ha='left', va='center')

plt.show()
Output:
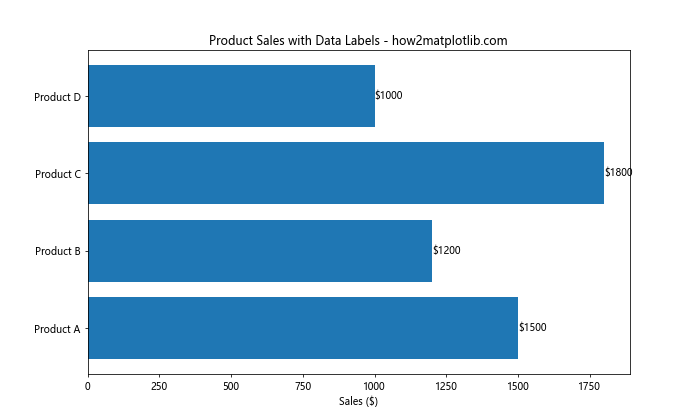
This example adds text labels at the end of each bar, showing the exact sales value for each product.
Handling Large Datasets with Matplotlib.pyplot.barh()
When dealing with large datasets, the Matplotlib.pyplot.barh() function can still be effectively used to create informative visualizations. Here are some techniques for handling large datasets:
Sorting and Displaying Top N Categories
When you have too many categories, it’s often useful to display only the top N categories:
import matplotlib.pyplot as plt
import random

# Generate a large dataset
categories = [f'Category {i}' for i in range(100)]
values = [random.randint(1, 1000) for _ in range(100)]

# Sort and select top 10
sorted_data = sorted(zip(categories, values), key=lambda x: x[1], reverse=True)
top_10 = sorted_data[:10]

categories, values = zip(*top_10)

plt.figure(figsize=(12, 8))
plt.barh(categories, values)
plt.title('Top 10 Categories - how2matplotlib.com')
plt.xlabel('Values')
plt.ylabel('Categories')
plt.show()
Output:
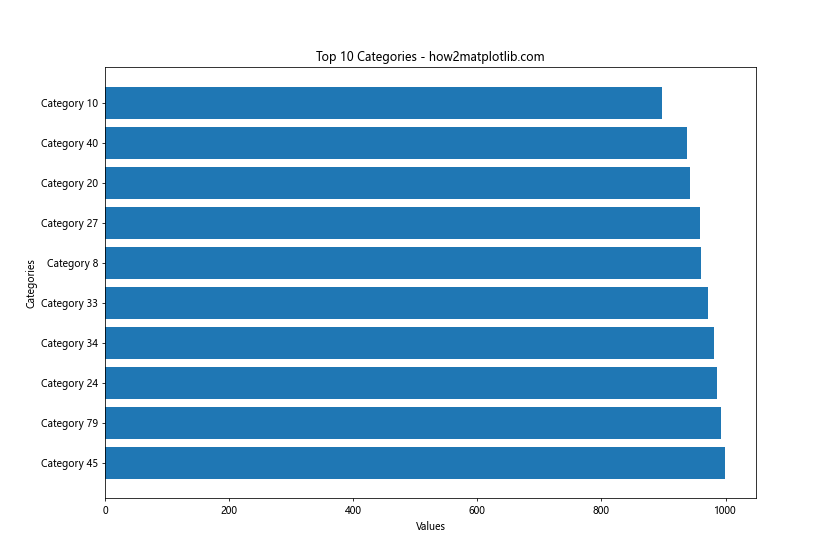
This example generates a large dataset, sorts it, and then displays only the top 10 categories.
Using Color Gradients for Large Datasets
Color gradients can help visualize trends in large datasets:
import matplotlib.pyplot as plt
import numpy as np

# Generate a large dataset
categories = [f'Item {i}' for i in range(50)]
values = np.random.randint(1, 1000, 50)

# Sort the data
sorted_indices = np.argsort(values)
categories = [categories[i] for i in sorted_indices]
values = values[sorted_indices]

plt.figure(figsize=(12, 10))
bars = plt.barh(categories, values)

# Create color gradient
colors = plt.cm.viridis(np.linspace(0, 1, len(categories)))
for bar, color in zip(bars, colors):
    bar.set_color(color)

plt.title('Large Dataset with Color Gradient - how2matplotlib.com')
plt.xlabel('Values')
plt.ylabel('Categories')
plt.show()
Output:
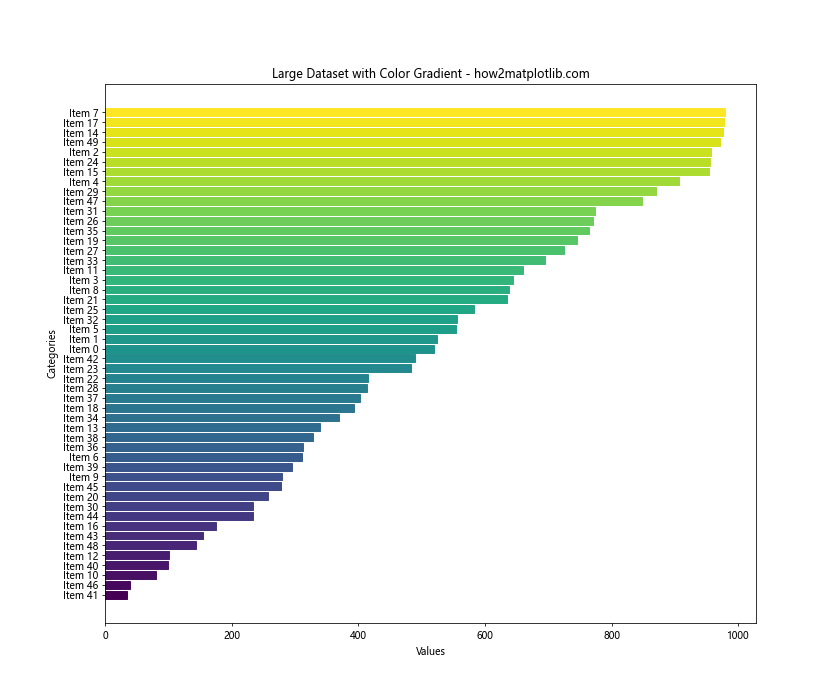
This example uses a color gradient to represent the magnitude of values, making it easier to identify trends in a large dataset.
Combining Matplotlib.pyplot.barh() with Other Plot Types
The Matplotlib.pyplot.barh() function can be combined with other plot types to create more complex visualizations:
Horizontal Bar Chart with Line Plot
Combining a horizontal bar chart with a line plot can be useful for comparing two different metrics:
import matplotlib.pyplot as plt
import numpy as np

categories = ['Category A', 'Category B', 'Category C', 'Category D', 'Category E']
bar_values = [30, 45, 25, 60, 40]
line_values = [20, 30, 35, 40, 50]

fig, ax1 = plt.subplots(figsize=(12, 6))

# Bar chart
ax1.barh(categories, bar_values, color='skyblue', alpha=0.7)
ax1.set_xlabel('Bar Values')
ax1.set_ylabel('Categories')

# Line plot
ax2 = ax1.twiny()
ax2.plot(line_values, categories, color='red', marker='o')
ax2.set_xlabel('Line Values')

plt.title('Horizontal Bar Chart with Line Plot - how2matplotlib.com')
plt.tight_layout()
plt.show()
Output:
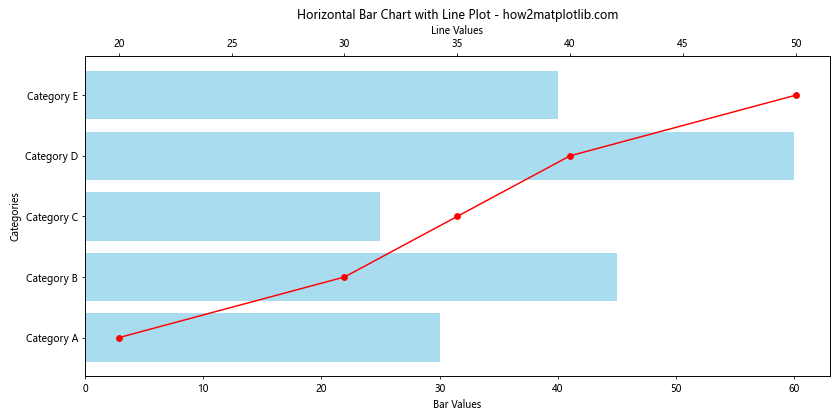
This example creates a horizontal bar chart and overlays it with a line plot, allowing for the comparison of two different metrics across categories.
Customizing Axes and Ticks in Matplotlib.pyplot.barh() Charts
Customizing axes and ticks can greatly enhance the readability and appearance of your horizontal bar charts:
Adjusting Tick Labels and Positions
You can customize the tick labels and their positions to better fit your data:
import matplotlib.pyplot as plt
import numpy as np

categories = ['Very Long Category Name A', 'Long Category B', 'Category C', 'D', 'E']
values = [30, 45, 25, 60, 40]

fig, ax = plt.subplots(figsize=(12, 6))

y_pos = np.arange(len(categories))
ax.barh(y_pos, values)

ax.set_yticks(y_pos)
ax.set_yticklabels(categories)

# Adjust label parameters for better readability
plt.tick_params(axis='y', which='major', labelsize=8, pad=10)
plt.subplots_adjust(left=0.3)

plt.title('Customized Tick Labels - how2matplotlib.com')
plt.xlabel('Values')
plt.show()
Output:
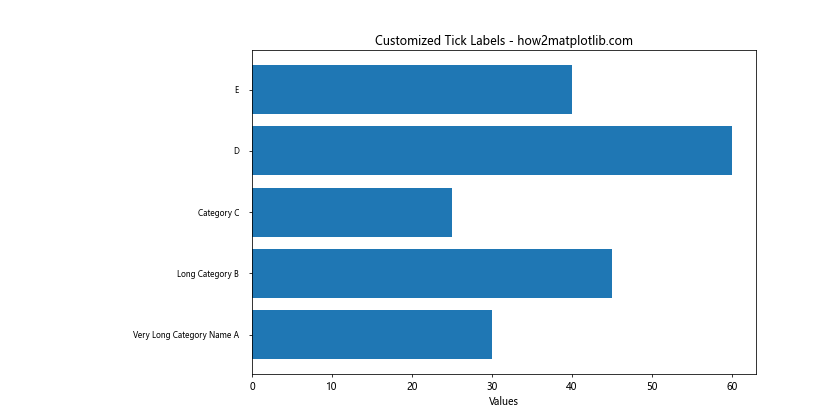
This example adjusts the y-axis tick labels to accommodate long category names and increases the left margin to prevent label cutoff.
Adding a Secondary Y-axis
Adding a secondary y-axis can be useful for displaying additional information:
import matplotlib.pyplot as plt

categories = ['Product A', 'Product B', 'Product C', 'Product D']
sales = [1500, 1200, 1800, 1000]
market_share = [25, 20, 30, 15]

fig, ax1 = plt.subplots(figsize=(12, 6))

ax1.barh(categories, sales, color='skyblue')
ax1.set_xlabel('Sales ($)')
ax1.set_ylabel('Products')

ax2 = ax1.twiny()
ax2.plot(market_share, categories, color='red', marker='o')
ax2.set_xlabel('Market Share (%)')

plt.title('Sales and Market Share - how2matplotlib.com')
plt.tight_layout()
plt.show()
Output:
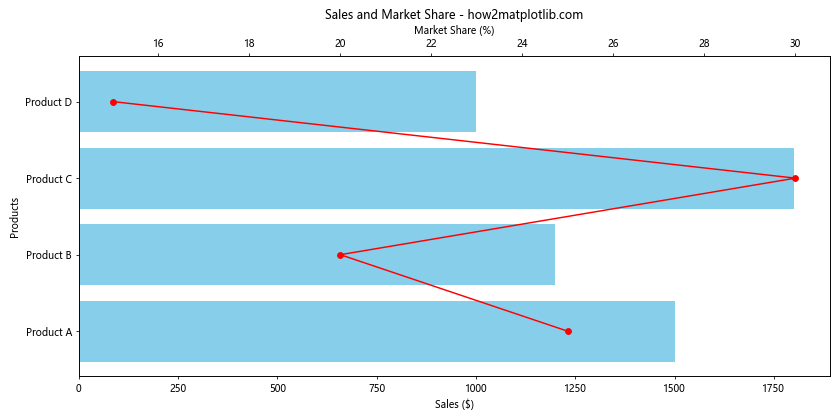
This example adds a secondary x-axis to display market share percentages alongside sales figures.
Applying Themes and Styles to Matplotlib.pyplot.barh() Charts
Matplotlib offers various built-in styles that can be applied to your charts to enhance their appearance:
Using Built-in Styles
You can easily apply different styles to your charts:
import matplotlib.pyplot as plt

categories = ['Category A', 'Category B', 'Category C', 'Category D']
values = [25, 40, 30, 55]

styles = ['default', 'ggplot', 'seaborn', 'fivethirtyeight']

fig, axs = plt.subplots(2, 2, figsize=(15, 12))
axs = axs.ravel()

for i, style in enumerate(styles):
    with plt.style.context(style):
        axs[i].barh(categories, values)
        axs[i].set_title(f'{style.capitalize()} Style - how2matplotlib.com')
        axs[i].set_xlabel('Values')
        axs[i].set_ylabel('Categories')

plt.tight_layout()
plt.show()
This example demonstrates four different built-in styles applied to the same horizontal bar chart.
Handling Negative Values in Matplotlib.pyplot.barh() Charts
The Matplotlib.pyplot.barh() function can also handle negative values, which is useful for displaying data that includes both positive and negative quantities:
import matplotlib.pyplot as plt

categories = ['Category A', 'Category B', 'Category C', 'Category D', 'Category E']
values = [30, -15, 45, -10, 25]

plt.figure(figsize=(10, 6))
bars = plt.barh(categories, values)

# Color positive and negative bars differently
for bar in bars:
    if bar.get_width() < 0:
        bar.set_color('red')
    else:
        bar.set_color('green')

plt.axvline(x=0, color='black', linestyle='-', linewidth=0.5)
plt.title('Horizontal Bar Chart with Positive and Negative Values - how2matplotlib.com')
plt.xlabel('Values')
plt.ylabel('Categories')
plt.show()
Output:
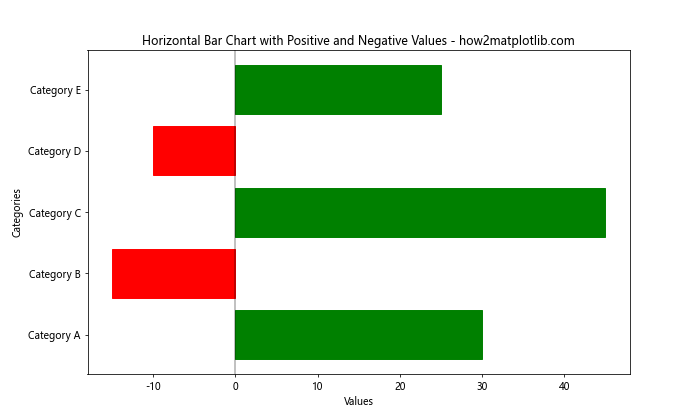
This example creates a horizontal bar chart with both positive and negative values, using different colors to distinguish between them and adding a vertical line at x=0 for reference.
Creating Animated Horizontal Bar Charts with Matplotlib.pyplot.barh()
You can create animated horizontal bar charts to show changes over time:
import matplotlib.pyplot as plt
import matplotlib.animation as animation
import numpy as np

categories = ['Category A', 'Category B', 'Category C', 'Category D']
data = np.random.randint(1, 100, (10, 4))  # 10 time points, 4 categories

fig, ax = plt.subplots(figsize=(10, 6))

def animate(i):
    ax.clear()
    ax.barh(categories, data[i])
    ax.set_xlim(0, 100)
    ax.set_title(f'Time Step {i+1} - how2matplotlib.com')

ani = animation.FuncAnimation(fig, animate, frames=10, repeat=True, interval=500)

plt.tight_layout()
plt.show()
Output:
This example creates an animated horizontal bar chart that updates every 500 milliseconds, showing changes in values over 10 time steps.
Customizing Bar Edges and Patterns in Matplotlib.pyplot.barh()
You can further customize the appearance of your horizontal bars by adjusting their edges and adding patterns:
import matplotlib.pyplot as plt
import numpy as np

categories = ['Category A', 'Category B', 'Category C', 'Category D']
values = [25, 40, 30, 55]

fig, ax = plt.subplots(figsize=(10, 6))

bars = ax.barh(categories, values, edgecolor='black', linewidth=2, hatch='//')

plt.title('Customized Bar Edges and Patterns - how2matplotlib.com')
plt.xlabel('Values')
plt.ylabel('Categories')
plt.show()
Output:
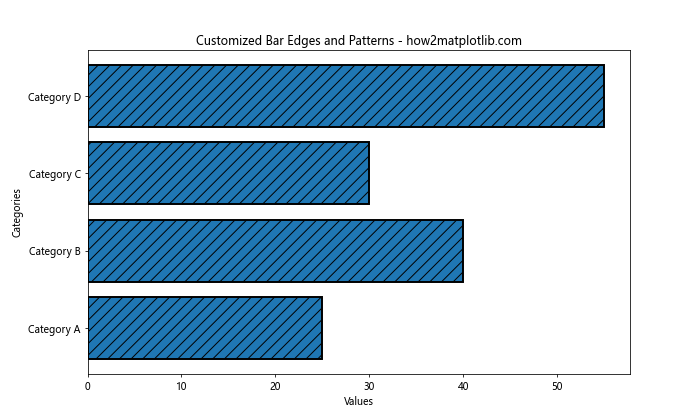
In this example, we add black edges to the bars and apply a hatching pattern to make them more visually distinct.
Using Matplotlib.pyplot.barh() for Comparative Analysis
The Matplotlib.pyplot.barh() function is particularly useful for comparative analysis, especially when dealing with multiple datasets:
import matplotlib.pyplot as plt
import numpy as np

categories = ['Product A', 'Product B', 'Product C', 'Product D']
sales_2020 = [1500, 1200, 1800, 1000]
sales_2021 = [1700, 1300, 1600, 1200]

x = np.arange(len(categories))
width = 0.35

fig, ax = plt.subplots(figsize=(12, 6))
ax.barh(x - width/2, sales_2020, width, label='2020', color='skyblue')
ax.barh(x + width/2, sales_2021, width, label='2021', color='orange')

ax.set_yticks(x)
ax.set_yticklabels(categories)
ax.legend()

plt.title('Sales Comparison 2020 vs 2021 - how2matplotlib.com')
plt.xlabel('Sales ($)')
plt.show()
Output:
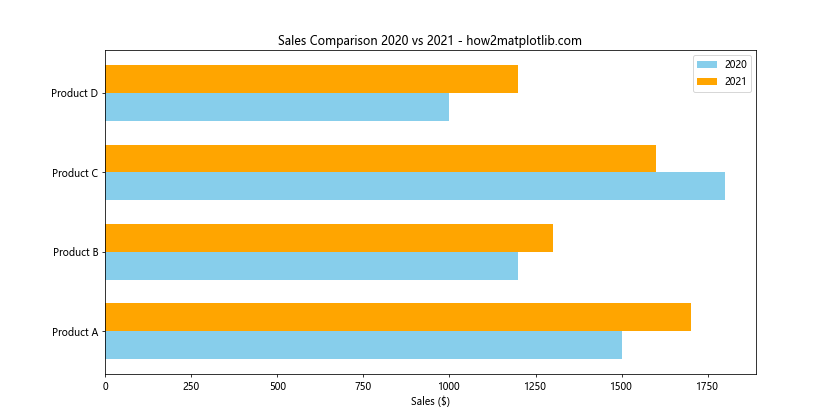
This example compares sales data for two different years using grouped horizontal bars.
Incorporating Text Annotations in Matplotlib.pyplot.barh() Charts
Adding text annotations to your horizontal bar charts can provide additional context or highlight specific data points:
import matplotlib.pyplot as plt

categories = ['Category A', 'Category B', 'Category C', 'Category D']
values = [25, 40, 30, 55]

fig, ax = plt.subplots(figsize=(10, 6))
bars = ax.barh(categories, values)

for i, v in enumerate(values):
    ax.text(v + 1, i, str(v), va='center')

ax.text(30, 2.5, 'Important\nNote', fontsize=12,
        bbox=dict(facecolor='yellow', alpha=0.5))

plt.title('Horizontal Bar Chart with Annotations - how2matplotlib.com')
plt.xlabel('Values')
plt.ylabel('Categories')
plt.show()
Output:
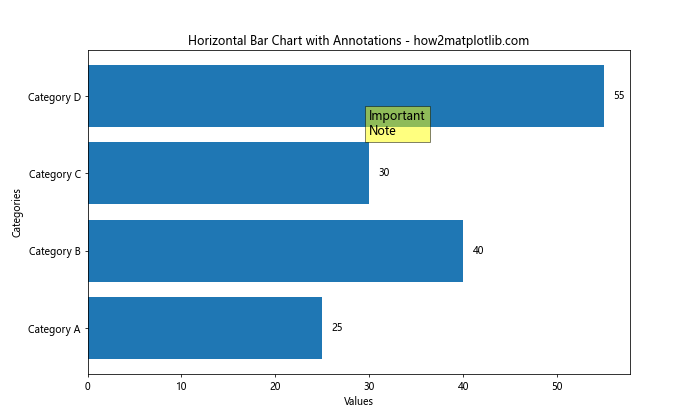
This example adds value labels at the end of each bar and includes a text box with an important note.
Creating Horizontal Bar Charts with Subplots using Matplotlib.pyplot.barh()
When you need to display multiple related horizontal bar charts, using subplots can be an effective approach:
import matplotlib.pyplot as plt

categories = ['A', 'B', 'C', 'D']
data_2019 = [20, 35, 30, 25]
data_2020 = [25, 32, 34, 20]
data_2021 = [30, 38, 28, 22]

fig, (ax1, ax2, ax3) = plt.subplots(3, 1, figsize=(10, 15))

ax1.barh(categories, data_2019)
ax1.set_title('2019 Data - how2matplotlib.com')

ax2.barh(categories, data_2020)
ax2.set_title('2020 Data - how2matplotlib.com')

ax3.barh(categories, data_2021)
ax3.set_title('2021 Data - how2matplotlib.com')

for ax in (ax1, ax2, ax3):
    ax.set_xlabel('Values')
    ax.set_ylabel('Categories')

plt.tight_layout()
plt.show()
Output:
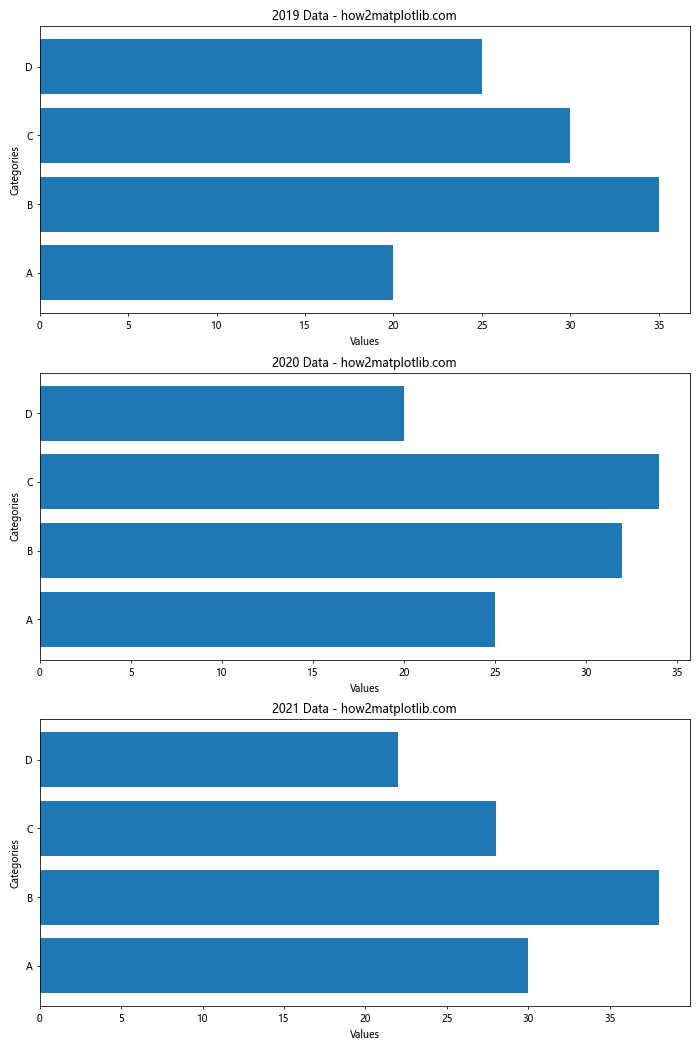
This example creates three separate horizontal bar charts as subplots, each representing data for a different year.
Conclusion: Mastering Matplotlib.pyplot.barh() for Effective Data Visualization
Throughout this comprehensive guide, we've explored the various aspects and capabilities of the Matplotlib.pyplot.barh() function in Python. From basic usage to advanced techniques, we've covered a wide range of topics to help you create effective and visually appealing horizontal bar charts.
The Matplotlib.pyplot.barh() function is a versatile tool that can be used for various data visualization tasks, including:
- Comparing values across different categories
- Visualizing trends in large datasets
- Creating stacked and grouped bar charts
- Combining with other plot types for more complex visualizations
- Customizing chart appearance with colors, styles, and annotations
- Handling both positive and negative values
- Creating animated charts to show changes over time