Comprehensive Guide to Using Matplotlib.axis.Tick.get_visible() in Python for Data Visualization

Comprehensive Guide to Using Matplotlib.axis.Tick.get_visible() in Python for Data Visualization

Matplotlib.axis.Tick.get_visible() in Python is a powerful method used in data visualization to determine the visibility status of tick marks on plot axes. This function is an essential tool for customizing the appearance of plots and enhancing their readability. In this comprehensive guide, we’ll explore the various aspects of Matplotlib.axis.Tick.get_visible() in Python, its usage, and how it can be leveraged to create more informative and visually appealing charts.

Understanding Matplotlib.axis.Tick.get_visible() in Python

Matplotlib.axis.Tick.get_visible() in Python is a method that returns a boolean value indicating whether a tick mark is visible or not. This function is part of the Matplotlib library, which is widely used for creating static, animated, and interactive visualizations in Python. The get_visible() method is specifically associated with the Tick objects of plot axes.

To better understand how Matplotlib.axis.Tick.get_visible() in Python works, let’s start with a simple example:

import matplotlib.pyplot as plt

# Create a simple plot
fig, ax = plt.subplots()
ax.plot([1, 2, 3, 4], [1, 4, 2, 3])

# Get the visibility status of the first x-axis tick
x_tick = ax.xaxis.get_major_ticks()[0]
is_visible = x_tick.get_visible()

print(f"Is the first x-axis tick visible? {is_visible}")

plt.title("How to use Matplotlib.axis.Tick.get_visible() - how2matplotlib.com")
plt.show()

Output:
Comprehensive Guide to Using Matplotlib.axis.Tick.get_visible() in Python for Data Visualization

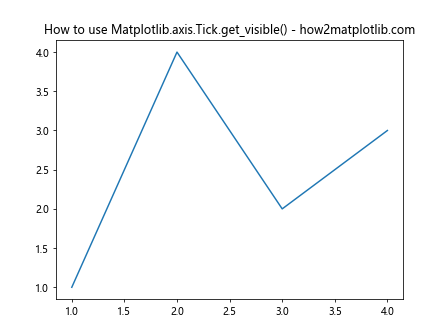
In this example, we create a simple line plot and then use Matplotlib.axis.Tick.get_visible() in Python to check the visibility of the first major tick on the x-axis. The get_visible() method returns True if the tick is visible, and False otherwise.

The Importance of Matplotlib.axis.Tick.get_visible() in Python

Matplotlib.axis.Tick.get_visible() in Python plays a crucial role in customizing and fine-tuning the appearance of plots. By allowing developers to check the visibility status of individual ticks, this method enables precise control over which ticks are displayed and which are hidden. This level of control is particularly useful when dealing with crowded axes or when emphasizing specific data points.

Let’s explore a more complex example to illustrate the importance of Matplotlib.axis.Tick.get_visible() in Python:

import matplotlib.pyplot as plt
import numpy as np

# Create data
x = np.linspace(0, 10, 100)
y = np.sin(x)

# Create plot
fig, ax = plt.subplots()
ax.plot(x, y)

# Get all major ticks on x-axis
x_ticks = ax.xaxis.get_major_ticks()

# Check visibility of each tick and print the result
for i, tick in enumerate(x_ticks):
    is_visible = tick.get_visible()
    print(f"X-axis tick {i} is visible: {is_visible}")

plt.title("Checking tick visibility with Matplotlib.axis.Tick.get_visible() - how2matplotlib.com")
plt.show()

Output:
Comprehensive Guide to Using Matplotlib.axis.Tick.get_visible() in Python for Data Visualization

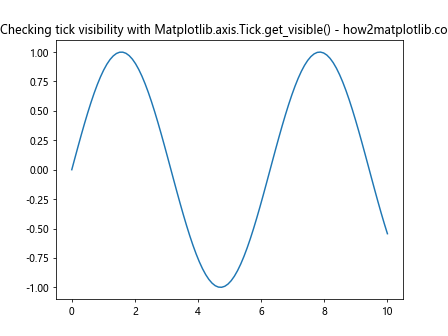
In this example, we create a sine wave plot and use Matplotlib.axis.Tick.get_visible() in Python to check the visibility of all major ticks on the x-axis. This information can be valuable when deciding which ticks to modify or hide for better plot readability.

Combining Matplotlib.axis.Tick.get_visible() with Other Matplotlib Functions

Matplotlib.axis.Tick.get_visible() in Python is often used in conjunction with other Matplotlib functions to create more sophisticated visualizations. By combining this method with functions that set tick visibility or modify tick properties, developers can create highly customized and informative plots.

Here’s an example that demonstrates how to use Matplotlib.axis.Tick.get_visible() in Python along with other Matplotlib functions:

import matplotlib.pyplot as plt
import numpy as np

# Create data
x = np.linspace(0, 10, 50)
y1 = np.sin(x)
y2 = np.cos(x)

# Create plot
fig, ax = plt.subplots()
ax.plot(x, y1, label='sin(x)')
ax.plot(x, y2, label='cos(x)')

# Get all major ticks on x-axis
x_ticks = ax.xaxis.get_major_ticks()

# Hide every other tick
for i, tick in enumerate(x_ticks):
    if i % 2 == 0:
        tick.set_visible(False)

# Check and print visibility of all ticks
for i, tick in enumerate(x_ticks):
    is_visible = tick.get_visible()
    print(f"X-axis tick {i} is visible: {is_visible}")

plt.title("Using Matplotlib.axis.Tick.get_visible() with other functions - how2matplotlib.com")
plt.legend()
plt.show()

Output:
Comprehensive Guide to Using Matplotlib.axis.Tick.get_visible() in Python for Data Visualization

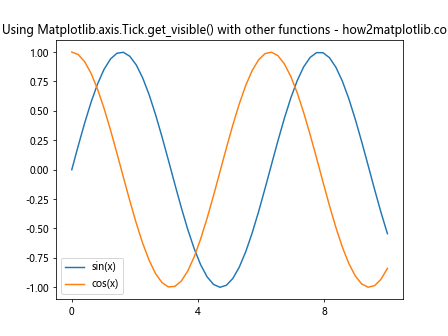
In this example, we create a plot with two trigonometric functions and then use Matplotlib.axis.Tick.get_visible() in Python to check the visibility of x-axis ticks after hiding every other tick. This combination of setting and getting tick visibility allows for precise control over the plot’s appearance.

Advanced Usage of Matplotlib.axis.Tick.get_visible() in Python

While the basic usage of Matplotlib.axis.Tick.get_visible() in Python is straightforward, there are more advanced techniques that can leverage this method to create complex and informative visualizations. Let’s explore some of these advanced uses:

1. Conditional Formatting Based on Tick Visibility

One advanced use of Matplotlib.axis.Tick.get_visible() in Python is to apply conditional formatting to plot elements based on tick visibility. This can be particularly useful when you want to highlight certain regions of your plot or create visual cues based on tick presence.

Here’s an example that demonstrates this concept:

import matplotlib.pyplot as plt
import numpy as np

# Create data
x = np.linspace(0, 10, 100)
y = np.sin(x)

# Create plot
fig, ax = plt.subplots()
line, = ax.plot(x, y)

# Get all major ticks on x-axis
x_ticks = ax.xaxis.get_major_ticks()

# Apply conditional formatting based on tick visibility
for i, tick in enumerate(x_ticks):
    is_visible = tick.get_visible()
    if is_visible:
        ax.axvspan(tick.get_loc() - 0.5, tick.get_loc() + 0.5, alpha=0.2, color='red')

plt.title("Conditional formatting with Matplotlib.axis.Tick.get_visible() - how2matplotlib.com")
plt.show()

Output:
Comprehensive Guide to Using Matplotlib.axis.Tick.get_visible() in Python for Data Visualization

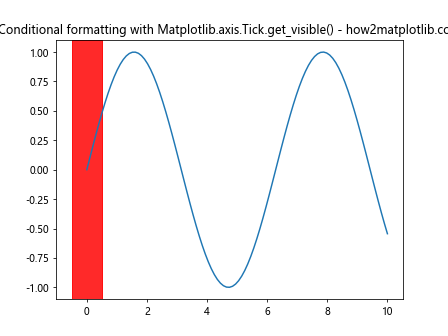
In this example, we use Matplotlib.axis.Tick.get_visible() in Python to check the visibility of each x-axis tick. For visible ticks, we add a light red background to highlight those regions of the plot.

2. Dynamic Tick Visibility Based on Zoom Level

Another advanced application of Matplotlib.axis.Tick.get_visible() in Python is to dynamically adjust tick visibility based on the current zoom level of the plot. This can help maintain readability when users zoom in or out of the visualization.

Here’s an example that implements this functionality:

import matplotlib.pyplot as plt
import numpy as np

# Create data
x = np.linspace(0, 100, 1000)
y = np.sin(x)

# Create plot
fig, ax = plt.subplots()
line, = ax.plot(x, y)

def on_xlims_change(event_ax):
    x_ticks = ax.xaxis.get_major_ticks()
    x_range = event_ax.get_xlim()[1] - event_ax.get_xlim()[0]

    for i, tick in enumerate(x_ticks):
        if x_range > 50:
            tick.set_visible(i % 2 == 0)
        else:
            tick.set_visible(True)

    fig.canvas.draw_idle()

ax.callbacks.connect('xlim_changed', on_xlims_change)

plt.title("Dynamic tick visibility with Matplotlib.axis.Tick.get_visible() - how2matplotlib.com")
plt.show()

Output:
Comprehensive Guide to Using Matplotlib.axis.Tick.get_visible() in Python for Data Visualization

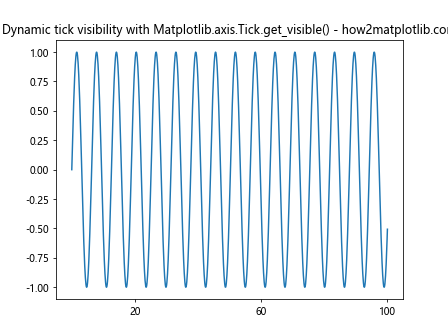
In this example, we define a callback function that adjusts tick visibility based on the current x-axis range. When the range is large, every other tick is hidden to reduce clutter. Matplotlib.axis.Tick.get_visible() in Python could be used within this function to check the current visibility status before making changes.

3. Custom Tick Labeling Based on Visibility

Matplotlib.axis.Tick.get_visible() in Python can also be used to create custom tick labeling schemes. By checking the visibility of ticks, you can apply different labeling strategies to visible and hidden ticks.

Here’s an example that demonstrates this technique:

import matplotlib.pyplot as plt
import numpy as np

# Create data
x = np.linspace(0, 10, 100)
y = np.sin(x)

# Create plot
fig, ax = plt.subplots()
ax.plot(x, y)

# Get all major ticks on x-axis
x_ticks = ax.xaxis.get_major_ticks()

# Custom labeling function
def custom_label(tick):
    if tick.get_visible():
        return f"{tick.get_loc():.1f}"
    else:
        return ""

# Apply custom labeling
ax.xaxis.set_major_formatter(plt.FuncFormatter(custom_label))

# Hide every other tick
for i, tick in enumerate(x_ticks):
    if i % 2 != 0:
        tick.set_visible(False)

plt.title("Custom tick labeling with Matplotlib.axis.Tick.get_visible() - how2matplotlib.com")
plt.show()

In this example, we use Matplotlib.axis.Tick.get_visible() in Python within a custom labeling function. Visible ticks are labeled with their location value, while hidden ticks have empty labels.

Best Practices for Using Matplotlib.axis.Tick.get_visible() in Python

When working with Matplotlib.axis.Tick.get_visible() in Python, it’s important to follow some best practices to ensure your code is efficient, readable, and maintainable. Here are some guidelines to consider:

  1. Combine with set_visible(): Often, you’ll want to use Matplotlib.axis.Tick.get_visible() in Python in conjunction with set_visible() to toggle tick visibility. This allows for dynamic control over tick appearance.

  2. Use for conditional formatting: Leverage Matplotlib.axis.Tick.get_visible() in Python to apply conditional formatting or styling to your plots based on tick visibility.

  3. Consider performance: When working with large datasets or complex plots, be mindful of the performance impact of repeatedly calling get_visible(). Consider caching the results if needed.

  4. Maintain consistency: When modifying tick visibility, ensure that your changes are consistent across the plot to maintain a professional appearance.

  5. Document your code: When using Matplotlib.axis.Tick.get_visible() in Python as part of a larger visualization strategy, make sure to document your code clearly to explain the rationale behind visibility changes.

Let’s look at an example that incorporates some of these best practices:

import matplotlib.pyplot as plt
import numpy as np

def create_custom_plot(x, y, highlight_range):
    fig, ax = plt.subplots()
    ax.plot(x, y)

    x_ticks = ax.xaxis.get_major_ticks()

    for tick in x_ticks:
        tick_loc = tick.get_loc()
        if highlight_range[0] <= tick_loc <= highlight_range[1]:
            if tick.get_visible():
                ax.axvspan(tick_loc - 0.5, tick_loc + 0.5, alpha=0.2, color='yellow')
                tick.label1.set_color('red')
        else:
            tick.set_visible(False)

    ax.set_title(f"Custom plot using Matplotlib.axis.Tick.get_visible() - how2matplotlib.com")
    return fig, ax

# Create data
x = np.linspace(0, 10, 100)
y = np.sin(x)

# Create custom plot
fig, ax = create_custom_plot(x, y, (3, 7))
plt.show()

Output:

Comprehensive Guide to Using Matplotlib.axis.Tick.get_visible() in Python for Data Visualization

In this example, we’ve created a custom plotting function that uses Matplotlib.axis.Tick.get_visible() in Python to apply conditional formatting. The function highlights a specific range of x-values and hides ticks outside this range. This approach demonstrates good code organization and the combination of get_visible() with other Matplotlib functions.

Common Pitfalls and How to Avoid Them

While Matplotlib.axis.Tick.get_visible() in Python is a useful tool, there are some common pitfalls that developers might encounter. Here are a few to be aware of and how to avoid them:

  1. Assuming all ticks are visible by default: Don’t assume that all ticks are visible by default. Always check with get_visible() before making changes.

  2. Forgetting to update the plot: After changing tick visibility, remember to call plt.draw() or fig.canvas.draw() to update the plot.

  3. Ignoring minor ticks: Don’t forget about minor ticks. They also have visibility settings that can be checked with get_visible().

  4. Not considering the impact on other plot elements: Changing tick visibility can affect other elements of your plot, such as grid lines. Always check the overall appearance after making changes.

Here’s an example that demonstrates how to avoid these pitfalls:

import matplotlib.pyplot as plt
import numpy as np

# Create data
x = np.linspace(0, 10, 100)
y = np.sin(x)

# Create plot
fig, ax = plt.subplots()
ax.plot(x, y)

# Get all major and minor ticks on x-axis
major_ticks = ax.xaxis.get_major_ticks()
minor_ticks = ax.xaxis.get_minor_ticks()

# Check and modify visibility of both major and minor ticks
for tick in major_ticks + minor_ticks:
    if not tick.get_visible():
        tick.set_visible(True)

    if isinstance(tick, plt.matplotlib.axis.XTick):
        if tick.get_loc() % 2 == 0:
            tick.set_visible(False)

# Update grid to match tick visibility
ax.grid(True, which='both', alpha=0.3)

# Redraw the figure to apply changes
fig.canvas.draw()

plt.title("Avoiding pitfalls with Matplotlib.axis.Tick.get_visible() - how2matplotlib.com")
plt.show()

Output:

Comprehensive Guide to Using Matplotlib.axis.Tick.get_visible() in Python for Data Visualization

In this example, we check and modify the visibility of both major and minor ticks, update the grid to match tick visibility, and redraw the figure to apply all changes. This approach helps avoid common pitfalls associated with using Matplotlib.axis.Tick.get_visible() in Python.

Matplotlib.axis.Tick.get_visible() in Python: Advanced Customization Techniques

As we delve deeper into the capabilities of Matplotlib.axis.Tick.get_visible() in Python, we can explore more advanced customization techniques that can significantly enhance the visual appeal and informativeness of our plots. Let’s look at some of these techniques:

1. Creating Custom Tick Patterns

Matplotlib.axis.Tick.get_visible() in Python can be used to create custom tick patterns that emphasize certain data points or ranges. This can be particularly useful when dealing with non-uniform data distributions or when you want to highlight specific regions of your plot.

Here’s an example that creates a custom tick pattern:

import matplotlib.pyplot as plt
import numpy as np

# Create data
x = np.linspace(0, 10, 100)
y = np.exp(x)

# Create plot
fig, ax = plt.subplots()
ax.plot(x, y)

# Get all major ticks on x-axis
x_ticks = ax.xaxis.get_major_ticks()

# Create custom tick pattern
for i,tick in enumerate(x_ticks):
    if i % 3 == 0:
        tick.set_visible(True)
        tick.label1.set_fontweight('bold')
    elif i % 3 == 1:
        tick.set_visible(True)
        tick.label1.set_fontsize(8)
    else:
        tick.set_visible(False)

# Check and print visibility of all ticks
for i, tick in enumerate(x_ticks):
    is_visible = tick.get_visible()
    print(f"X-axis tick {i} is visible: {is_visible}")

plt.title("Custom tick pattern using Matplotlib.axis.Tick.get_visible() - how2matplotlib.com")
plt.show()

Output:

Comprehensive Guide to Using Matplotlib.axis.Tick.get_visible() in Python for Data Visualization

In this example, we create a custom tick pattern where every third tick is bold, every second visible tick is smaller, and every third tick is hidden. This pattern can help draw attention to specific data points or intervals.

2. Adaptive Tick Visibility

Another advanced technique is to implement adaptive tick visibility that changes based on the data being displayed. This can be particularly useful when dealing with dynamic data or when creating interactive plots.

Here’s an example of adaptive tick visibility:

import matplotlib.pyplot as plt
import numpy as np

def adaptive_tick_visibility(ax, threshold):
    x_ticks = ax.xaxis.get_major_ticks()
    y_data = ax.get_lines()[0].get_ydata()

    for tick in x_ticks:
        tick_loc = tick.get_loc()
        if tick_loc < len(y_data):
            if y_data[int(tick_loc)] > threshold:
                tick.set_visible(True)
            else:
                tick.set_visible(False)

# Create data
x = np.linspace(0, 10, 100)
y = np.sin(x) * np.exp(-x/10)

# Create plot
fig, ax = plt.subplots()
ax.plot(x, y)

# Apply adaptive tick visibility
adaptive_tick_visibility(ax, 0.3)

plt.title("Adaptive tick visibility with Matplotlib.axis.Tick.get_visible() - how2matplotlib.com")
plt.show()

Output:

Comprehensive Guide to Using Matplotlib.axis.Tick.get_visible() in Python for Data Visualization

In this example, we create a function that adjusts tick visibility based on the y-values of the plotted data. Ticks are only visible for x-values where the corresponding y-value exceeds a certain threshold.

3. Interactive Tick Visibility Control

Matplotlib.axis.Tick.get_visible() in Python can also be used to create interactive controls for tick visibility. This can be especially useful in data exploration tools or interactive dashboards.

Here’s an example of how to implement interactive tick visibility control:

import matplotlib.pyplot as plt
import numpy as np
from matplotlib.widgets import CheckButtons

# Create data
x = np.linspace(0, 10, 100)
y = np.sin(x)

# Create plot
fig, ax = plt.subplots()
line, = ax.plot(x, y)

# Create check buttons for tick visibility
rax = plt.axes([0.05, 0.4, 0.1, 0.15])
check = CheckButtons(rax, ('Even', 'Odd'), (True, True))

def func(label):
    x_ticks = ax.xaxis.get_major_ticks()
    if label == 'Even':
        for i, tick in enumerate(x_ticks):
            if i % 2 == 0:
                tick.set_visible(not tick.get_visible())
    elif label == 'Odd':
        for i, tick in enumerate(x_ticks):
            if i % 2 != 0:
                tick.set_visible(not tick.get_visible())
    plt.draw()

check.on_clicked(func)

plt.title("Interactive tick visibility control - how2matplotlib.com")
plt.show()

Output:

Comprehensive Guide to Using Matplotlib.axis.Tick.get_visible() in Python for Data Visualization

In this example, we create check buttons that allow the user to toggle the visibility of even and odd ticks interactively. The Matplotlib.axis.Tick.get_visible() method is used to check the current visibility state before toggling.

Matplotlib.axis.Tick.get_visible() in Python: Integration with Other Libraries

While Matplotlib is a powerful library on its own, Matplotlib.axis.Tick.get_visible() in Python can also be integrated with other data visualization and analysis libraries to create even more sophisticated visualizations. Let’s explore how this method can be used in conjunction with some popular libraries:

1. Integration with Pandas

Pandas is a widely used data manipulation library in Python. When working with Pandas DataFrames, you can use Matplotlib.axis.Tick.get_visible() in Python to create custom visualizations based on your data.

Here’s an example that demonstrates this integration:

import matplotlib.pyplot as plt
import pandas as pd
import numpy as np

# Create a sample DataFrame
df = pd.DataFrame({
    'Date': pd.date_range(start='2023-01-01', periods=100),
    'Value': np.random.randn(100).cumsum()
})

# Create plot
fig, ax = plt.subplots(figsize=(12, 6))
ax.plot(df['Date'], df['Value'])

# Customize tick visibility
x_ticks = ax.xaxis.get_major_ticks()
for i, tick in enumerate(x_ticks):
    if i % 7 != 0:  # Show only weekly ticks
        tick.set_visible(False)

# Rotate and align the tick labels so they look better
plt.gcf().autofmt_xdate()

plt.title("Pandas integration with Matplotlib.axis.Tick.get_visible() - how2matplotlib.com")
plt.show()

Output:

Comprehensive Guide to Using Matplotlib.axis.Tick.get_visible() in Python for Data Visualization

In this example, we create a time series plot using Pandas and Matplotlib, then use Matplotlib.axis.Tick.get_visible() in Python to show only weekly ticks, reducing clutter on the x-axis.

2. Integration with Seaborn

Seaborn is a statistical data visualization library built on top of Matplotlib. While Seaborn provides its own high-level interface, you can still access and modify the underlying Matplotlib objects, including using Matplotlib.axis.Tick.get_visible() in Python.

Here’s an example of how to use Matplotlib.axis.Tick.get_visible() with a Seaborn plot:

import matplotlib.pyplot as plt
import seaborn as sns
import numpy as np

# Create sample data
x = np.linspace(0, 10, 100)
y = np.sin(x) + np.random.normal(0, 0.1, 100)

# Create Seaborn plot
sns.set_style("whitegrid")
fig, ax = plt.subplots(figsize=(10, 6))
sns.scatterplot(x=x, y=y, ax=ax)

# Customize tick visibility using Matplotlib
x_ticks = ax.xaxis.get_major_ticks()
for i, tick in enumerate(x_ticks):
    if i % 2 != 0:
        tick.set_visible(False)

plt.title("Seaborn integration with Matplotlib.axis.Tick.get_visible() - how2matplotlib.com")
plt.show()

Output:

Comprehensive Guide to Using Matplotlib.axis.Tick.get_visible() in Python for Data Visualization

In this example, we create a scatter plot using Seaborn, then use Matplotlib.axis.Tick.get_visible() in Python to hide every other tick on the x-axis, creating a cleaner look.

Matplotlib.axis.Tick.get_visible() in Python: Performance Considerations

When working with large datasets or creating multiple plots, it’s important to consider the performance implications of using Matplotlib.axis.Tick.get_visible() in Python. Here are some tips to optimize performance:

  1. Minimize repeated calls: Instead of calling get_visible() multiple times on the same tick, store the result in a variable if you need to use it more than once.

  2. Batch operations: If you’re modifying multiple ticks, try to batch your operations rather than updating the plot after each change.

  3. Use view limits: When dealing with large datasets, consider using view limits to reduce the number of visible ticks, which can improve performance.

Here’s an example that demonstrates these performance considerations:

import matplotlib.pyplot as plt
import numpy as np
import time

def create_optimized_plot(x, y):
    fig, ax = plt.subplots()
    ax.plot(x, y)

    x_ticks = ax.xaxis.get_major_ticks()
    visible_ticks = []

    # Batch visibility checks and modifications
    for i, tick in enumerate(x_ticks):
        is_visible = tick.get_visible()
        if is_visible and i % 2 == 0:
            visible_ticks.append(tick)
        else:
            tick.set_visible(False)

    # Batch formatting for visible ticks
    for tick in visible_ticks:
        tick.label1.set_fontweight('bold')

    ax.set_xlim(0, 100)  # Set view limits to reduce number of visible ticks

    plt.title("Optimized plot using Matplotlib.axis.Tick.get_visible() - how2matplotlib.com")
    return fig, ax

# Create large dataset
x = np.linspace(0, 1000, 10000)
y = np.sin(x) + np.random.normal(0, 0.1, 10000)

# Measure execution time
start_time = time.time()
fig, ax = create_optimized_plot(x, y)
end_time = time.time()

print(f"Execution time: {end_time - start_time:.4f} seconds")

plt.show()

Output:

Comprehensive Guide to Using Matplotlib.axis.Tick.get_visible() in Python for Data Visualization

In this example, we implement several optimizations:
1. We batch our visibility checks and modifications.
2. We store visible ticks in a separate list to avoid repeated calls to get_visible().
3. We set view limits to reduce the number of visible ticks.

These optimizations can significantly improve performance when working with large datasets or creating multiple plots.

Conclusion

Matplotlib.axis.Tick.get_visible() in Python is a powerful tool for customizing and fine-tuning the appearance of plots. Throughout this comprehensive guide, we’ve explored its basic usage, advanced techniques, integration with other libraries, and performance considerations.

By leveraging Matplotlib.axis.Tick.get_visible() in Python, you can create more informative, visually appealing, and tailored data visualizations. Whether you’re working on simple plots or complex, interactive dashboards, understanding how to effectively use this method will greatly enhance your data visualization capabilities.

Like(0)

Matplotlib Articles