Comprehensive Guide to Using Matplotlib.pyplot.plot_date() Function in Python for Time Series Visualization
Matplotlib.pyplot.plot_date() function in Python is a powerful tool for visualizing time series data. This function is specifically designed to handle date and time data on the x-axis, making it an essential component of the Matplotlib library for creating date-based plots. In this comprehensive guide, we’ll explore the various aspects of the plot_date() function, its parameters, usage, and provide numerous examples to illustrate its capabilities.
Understanding the Basics of Matplotlib.pyplot.plot_date()
Matplotlib.pyplot.plot_date() function in Python is primarily used to create line and/or marker plots specifically for date data. It’s particularly useful when you need to visualize time series data, such as stock prices over time, temperature readings throughout a day, or any other data that has a temporal component.
The basic syntax of the plot_date() function is as follows:
import matplotlib.pyplot as plt
import numpy as np
from datetime import datetime, timedelta

# Generate sample data
dates = [datetime.now() + timedelta(days=i) for i in range(10)]
values = np.random.rand(10)

# Create the plot
plt.plot_date(dates, values, linestyle='-', marker='o')
plt.title('Sample Time Series Plot - how2matplotlib.com')
plt.xlabel('Date')
plt.ylabel('Value')
plt.gcf().autofmt_xdate()  # Rotate and align the tick labels
plt.show()
Output:
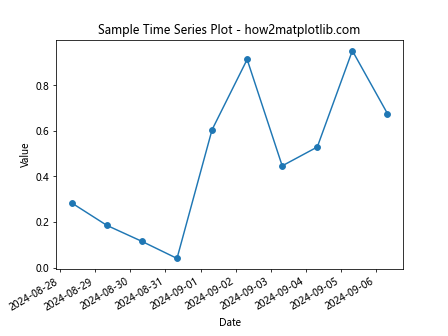
In this example, we’re creating a simple time series plot using randomly generated data. The plot_date() function takes the dates as the x-axis values and the corresponding data points as the y-axis values. We’ve also added a line connecting the points and markers at each data point.
Key Parameters of Matplotlib.pyplot.plot_date()
Matplotlib.pyplot.plot_date() function in Python comes with several parameters that allow you to customize your plots. Let’s explore some of the most important ones:
- x: This parameter represents the sequence of dates to be plotted on the x-axis.
- y: This parameter represents the corresponding y values for each date.
- fmt: This optional parameter specifies the plot format string. It combines a color, a line style, and a marker style.
- tz: This parameter allows you to specify the time zone for the x-axis.
- xdate: A boolean parameter that, when True, interprets the x-axis values as dates.
- ydate: Similar to xdate, but for the y-axis.
Let’s see an example that demonstrates the use of these parameters:
import matplotlib.pyplot as plt
import numpy as np
from datetime import datetime, timedelta
import pytz

# Generate sample data
dates = [datetime.now(pytz.UTC) + timedelta(days=i) for i in range(7)]
values = np.random.rand(7)

# Create the plot
plt.plot_date(dates, values, fmt='r-o', tz=pytz.timezone('US/Eastern'))
plt.title('Weekly Data - how2matplotlib.com')
plt.xlabel('Date (US/Eastern)')
plt.ylabel('Value')
plt.gcf().autofmt_xdate()
plt.show()
Output:
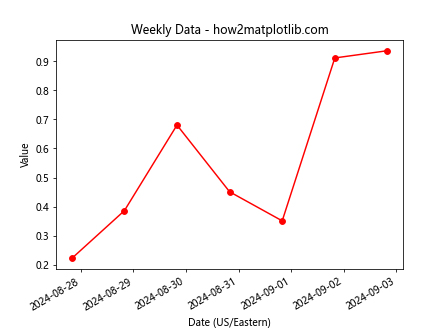
In this example, we’re using the fmt parameter to specify red lines with circular markers. We’re also setting the time zone to US/Eastern using the tz parameter.
Customizing Date Formatting with Matplotlib.pyplot.plot_date()
Matplotlib.pyplot.plot_date() function in Python allows for extensive customization of date formatting on the x-axis. This is particularly useful when dealing with different time scales or when you need to highlight specific aspects of your temporal data.
Here’s an example that demonstrates custom date formatting:
import matplotlib.pyplot as plt
import matplotlib.dates as mdates
from datetime import datetime, timedelta

# Generate sample data
start_date = datetime(2023, 1, 1)
dates = [start_date + timedelta(days=i) for i in range(365)]
values = [i**2 for i in range(365)]

# Create the plot
fig, ax = plt.subplots(figsize=(12, 6))
ax.plot_date(dates, values, linestyle='-', marker='')

# Customize the date formatting
ax.xaxis.set_major_locator(mdates.MonthLocator())
ax.xaxis.set_major_formatter(mdates.DateFormatter('%b %Y'))
ax.xaxis.set_minor_locator(mdates.DayLocator())

plt.title('Daily Data for 2023 - how2matplotlib.com')
plt.xlabel('Date')
plt.ylabel('Value')
fig.autofmt_xdate()
plt.show()
Output:
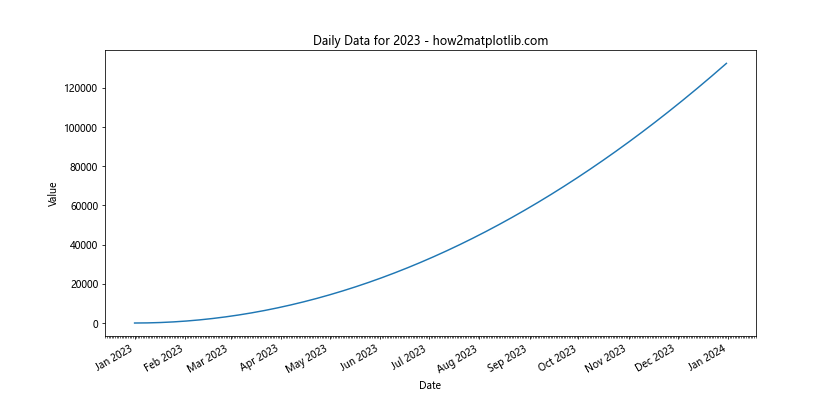
In this example, we’re using matplotlib.dates to set custom locators and formatters for the x-axis. We’re displaying major ticks for each month and minor ticks for each day, with the month and year formatted as ‘MMM YYYY’.
Handling Different Time Scales with Matplotlib.pyplot.plot_date()
Matplotlib.pyplot.plot_date() function in Python is versatile enough to handle various time scales, from seconds to years. Let’s look at examples for different time scales:
Hourly Data
import matplotlib.pyplot as plt
import numpy as np
from datetime import datetime, timedelta

# Generate hourly data for a day
start_time = datetime(2023, 6, 1)
hours = 24
times = [start_time + timedelta(hours=i) for i in range(hours)]
temperatures = np.random.normal(25, 5, hours)

plt.figure(figsize=(12, 6))
plt.plot_date(times, temperatures, linestyle='-', marker='o')
plt.title('Hourly Temperatures - how2matplotlib.com')
plt.xlabel('Time')
plt.ylabel('Temperature (°C)')
plt.gcf().autofmt_xdate()
plt.show()
Output:
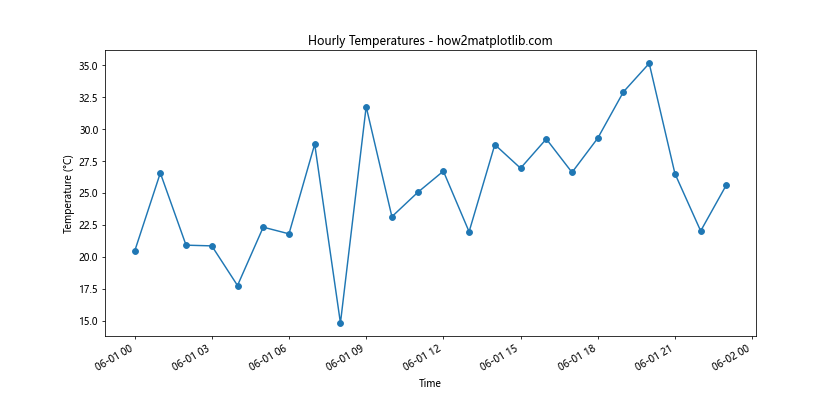
This example plots hourly temperature data for a single day.
Weekly Data
import matplotlib.pyplot as plt
import numpy as np
from datetime import datetime, timedelta

# Generate weekly data for a year
start_date = datetime(2023, 1, 1)
weeks = 52
dates = [start_date + timedelta(weeks=i) for i in range(weeks)]
sales = np.cumsum(np.random.normal(1000, 200, weeks))

plt.figure(figsize=(12, 6))
plt.plot_date(dates, sales, linestyle='-', marker='o')
plt.title('Weekly Sales Data - how2matplotlib.com')
plt.xlabel('Date')
plt.ylabel('Cumulative Sales')
plt.gcf().autofmt_xdate()
plt.show()
Output:
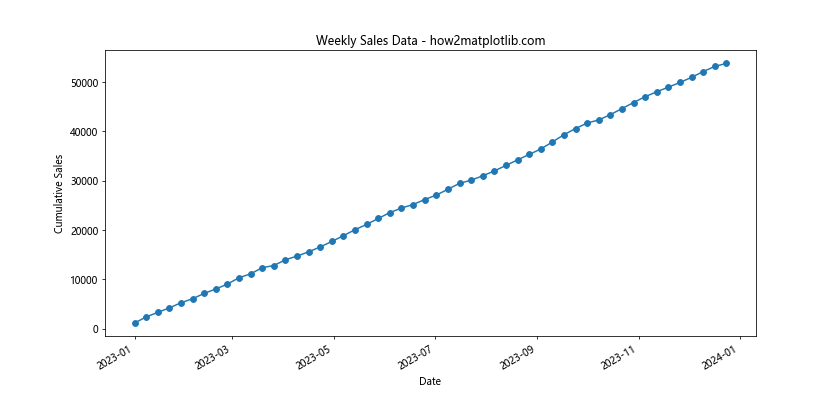
This example shows weekly sales data over the course of a year.
Monthly Data
import matplotlib.pyplot as plt
import numpy as np
from datetime import datetime, timedelta

# Generate monthly data for 5 years
start_date = datetime(2019, 1, 1)
months = 60
dates = [start_date + timedelta(days=30*i) for i in range(months)]
stock_prices = np.cumsum(np.random.normal(0, 10, months)) + 100

plt.figure(figsize=(12, 6))
plt.plot_date(dates, stock_prices, linestyle='-', marker='o')
plt.title('Monthly Stock Prices - how2matplotlib.com')
plt.xlabel('Date')
plt.ylabel('Stock Price')
plt.gcf().autofmt_xdate()
plt.show()
Output:
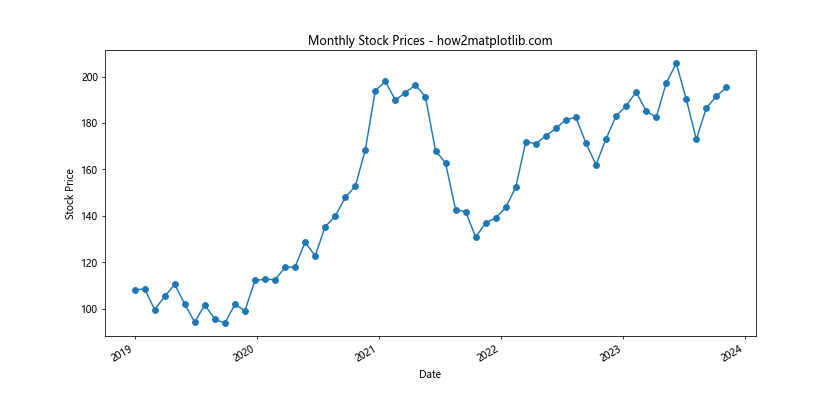
This example visualizes monthly stock price data over a 5-year period.
Combining Multiple Time Series with Matplotlib.pyplot.plot_date()
Matplotlib.pyplot.plot_date() function in Python allows you to plot multiple time series on the same graph, which is useful for comparison purposes. Here’s an example:
import matplotlib.pyplot as plt
import numpy as np
from datetime import datetime, timedelta

# Generate sample data for two time series
start_date = datetime(2023, 1, 1)
days = 365
dates = [start_date + timedelta(days=i) for i in range(days)]
series1 = np.cumsum(np.random.normal(0, 1, days))
series2 = np.cumsum(np.random.normal(0, 1, days))

plt.figure(figsize=(12, 6))
plt.plot_date(dates, series1, linestyle='-', marker='', label='Series 1')
plt.plot_date(dates, series2, linestyle='-', marker='', label='Series 2')
plt.title('Comparison of Two Time Series - how2matplotlib.com')
plt.xlabel('Date')
plt.ylabel('Value')
plt.legend()
plt.gcf().autofmt_xdate()
plt.show()
Output:
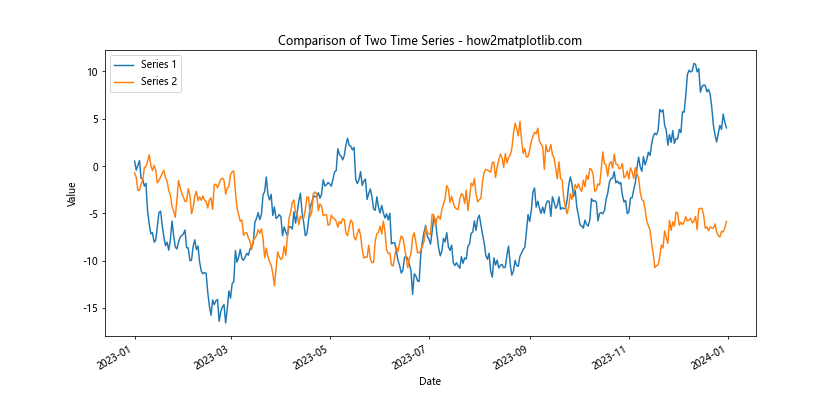
This example plots two different time series on the same graph, allowing for easy comparison.
Adding Annotations to Matplotlib.pyplot.plot_date() Plots
Annotations can be added to plots created with Matplotlib.pyplot.plot_date() function in Python to highlight specific points or provide additional information. Here’s an example:
import matplotlib.pyplot as plt
import numpy as np
from datetime import datetime, timedelta

# Generate sample data
start_date = datetime(2023, 1, 1)
days = 365
dates = [start_date + timedelta(days=i) for i in range(days)]
values = np.cumsum(np.random.normal(0, 1, days))

# Find the maximum value
max_index = np.argmax(values)
max_date = dates[max_index]
max_value = values[max_index]

plt.figure(figsize=(12, 6))
plt.plot_date(dates, values, linestyle='-', marker='')
plt.annotate(f'Max: {max_value:.2f}',
             xy=(max_date, max_value),
             xytext=(10, 10),
             textcoords='offset points',
             arrowprops=dict(arrowstyle='->'))

plt.title('Time Series with Annotation - how2matplotlib.com')
plt.xlabel('Date')
plt.ylabel('Value')
plt.gcf().autofmt_xdate()
plt.show()
Output:
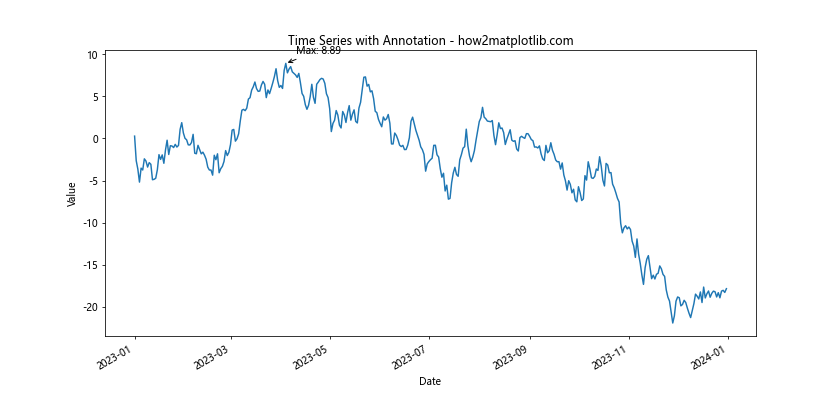
This example adds an annotation to the maximum point in the time series.
Customizing Markers and Lines in Matplotlib.pyplot.plot_date()
Matplotlib.pyplot.plot_date() function in Python offers various options for customizing markers and lines. Here’s an example demonstrating some of these options:
import matplotlib.pyplot as plt
import numpy as np
from datetime import datetime, timedelta

# Generate sample data
start_date = datetime(2023, 1, 1)
days = 30
dates = [start_date + timedelta(days=i) for i in range(days)]
values = np.random.rand(days)

plt.figure(figsize=(12, 6))
plt.plot_date(dates, values, linestyle='--', linewidth=2, marker='o',
              markersize=8, markerfacecolor='red', markeredgecolor='black')
plt.title('Customized Markers and Lines - how2matplotlib.com')
plt.xlabel('Date')
plt.ylabel('Value')
plt.gcf().autofmt_xdate()
plt.show()
Output:
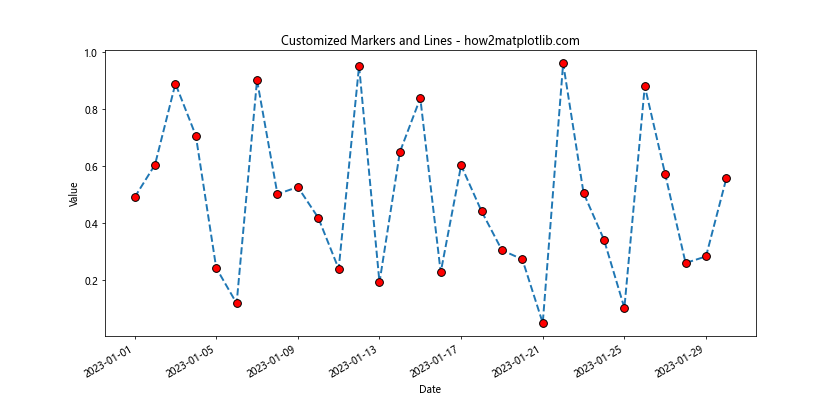
In this example, we’re using a dashed line style, larger line width, circular markers with red fill and black edge.
Handling Missing Data in Matplotlib.pyplot.plot_date()
When dealing with real-world time series data, it’s common to encounter missing values. Matplotlib.pyplot.plot_date() function in Python can handle such scenarios. Here’s an example:
import matplotlib.pyplot as plt
import numpy as np
from datetime import datetime, timedelta

# Generate sample data with missing values
start_date = datetime(2023, 1, 1)
days = 30
dates = [start_date + timedelta(days=i) for i in range(days)]
values = np.random.rand(days)
values[5:10] = np.nan  # Introduce missing values

plt.figure(figsize=(12, 6))
plt.plot_date(dates, values, linestyle='-', marker='o')
plt.title('Time Series with Missing Data - how2matplotlib.com')
plt.xlabel('Date')
plt.ylabel('Value')
plt.gcf().autofmt_xdate()
plt.show()
Output:
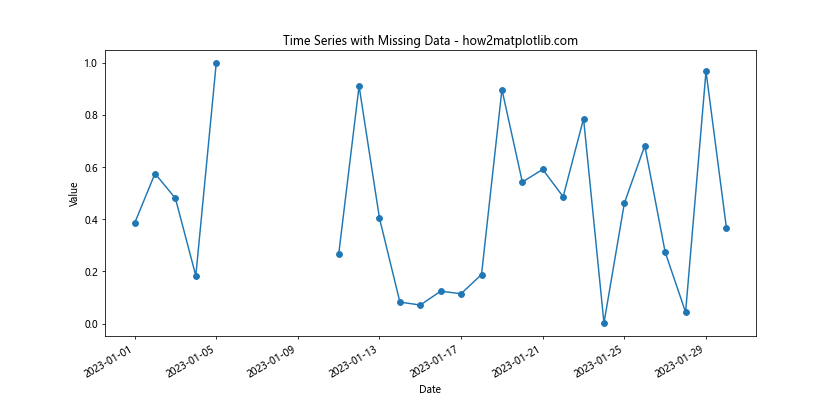
In this example, we’ve introduced some missing values (NaN) in our data. Matplotlib will automatically handle these by not plotting points for the missing values.
Creating Subplots with Matplotlib.pyplot.plot_date()
Matplotlib.pyplot.plot_date() function in Python can be used to create subplots, allowing you to display multiple time series plots in a single figure. Here’s an example:
import matplotlib.pyplot as plt
import numpy as np
from datetime import datetime, timedelta

# Generate sample data
start_date = datetime(2023, 1, 1)
days = 365
dates = [start_date + timedelta(days=i) for i in range(days)]
series1 = np.cumsum(np.random.normal(0, 1, days))
series2 = np.cumsum(np.random.normal(0, 1, days))

fig, (ax1, ax2) = plt.subplots(2, 1, figsize=(12, 10))

ax1.plot_date(dates, series1, linestyle='-', marker='')
ax1.set_title('Series 1 - how2matplotlib.com')
ax1.set_xlabel('Date')
ax1.set_ylabel('Value')

ax2.plot_date(dates, series2, linestyle='-', marker='')
ax2.set_title('Series 2 - how2matplotlib.com')
ax2.set_xlabel('Date')
ax2.set_ylabel('Value')

fig.autofmt_xdate()
plt.tight_layout()
plt.show()
Output:
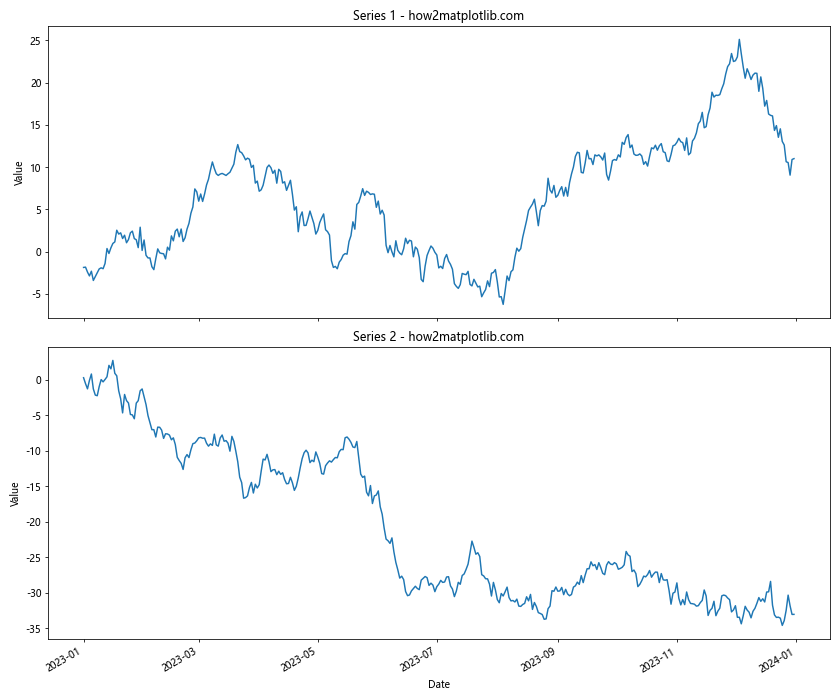
This example creates two subplots, each displaying a different time series.
Adding a Secondary Y-axis with Matplotlib.pyplot.plot_date()
When working with time series data, you might want to plot two series with different scales on the same graph. Matplotlib.pyplot.plot_date() function in Python allows you to add a secondary y-axis for this purpose. Here’s an example:
import matplotlib.pyplot as plt
import numpy as np
from datetime import datetime, timedelta

# Generate sample data
start_date = datetime(2023, 1, 1)
days = 365
dates = [start_date + timedelta(days=i) for i in range(days)]
temperature = np.random.normal(20, 5, days)
rainfall = np.random.exponential(5, days)

fig, ax1 = plt.subplots(figsize=(12, 6))

color = 'tab:red'
ax1.set_xlabel('Date')
ax1.set_ylabel('Temperature (°C)', color=color)
ax1.plot_date(dates, temperature, linestyle='-', color=color)
ax1.tick_params(axis='y', labelcolor=color)

ax2 = ax1.twinx()  # instantiate a second axes that shares the same x-axis

color = 'tab:blue'
ax2.set_ylabel('Rainfall (mm)', color=color)
ax2.plot_date(dates, rainfall, linestyle='-', color=color)
ax2.tick_params(axis='y', labelcolor=color)

plt.title('Temperature and Rainfall Over Time - how2matplotlib.com')
fig.autofmt_xdate()
plt.show()
Output:
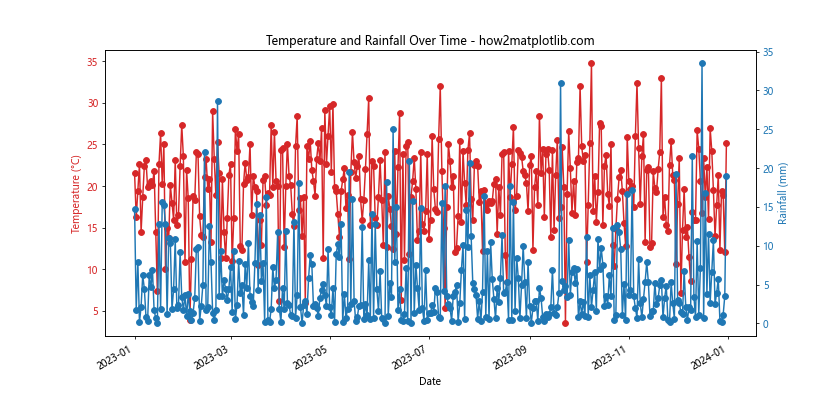
This example plots temperature and rainfall data on the same graph using two different y-axes.
Customizing Grid Lines with Matplotlib.pyplot.plot_date()
Grid lines can be added to plots created with Matplotlib.pyplot.plot_date() function in Python to improve readability. Here’s an example demonstrating how to customize grid lines:
import matplotlib.pyplot as plt
import numpy as np
from datetime import datetime, timedelta

# Generate sample data
start_date = datetime(2023, 1, 1)
days = 365
dates = [start_date + timedelta(days=i) for i in range(days)]
values = np.cumsum(np.random.normal(0, 1, days))

plt.figure(figsize=(12, 6))
plt.plot_date(dates, values, linestyle='-', marker='')
plt.title('Time Series with Custom Grid - how2matplotlib.com')
plt.xlabel('Date')
plt.ylabel('Value')

# Customize grid
plt.grid(True, which='major', color='#888888', linestyle='-', linewidth=0.5)
plt.grid(True, which='minor', color='#CCCCCC', linestyle=':', linewidth=0.5)

plt.gcf().autofmt_xdate()
plt.show()
Output:
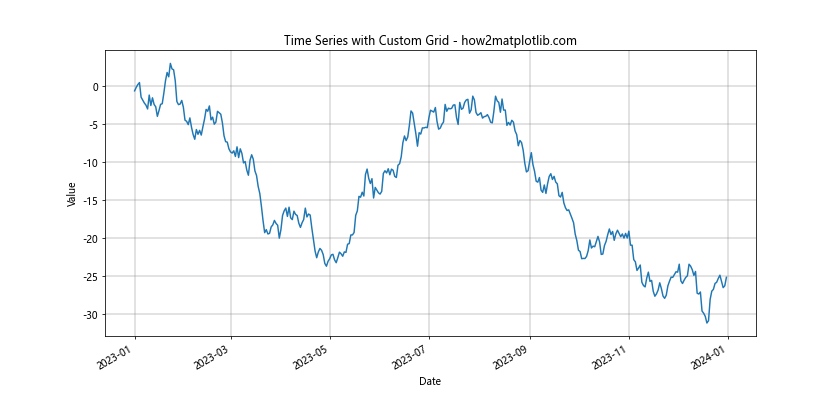
In this example, we’ve added major grid lines in dark gray and minor grid lines in light gray. The major grid lines are solid, while the minor grid lines are dotted.
Adding Error Bars to Matplotlib.pyplot.plot_date() Plots
When working with time series data, it’s often useful to include error bars to represent uncertainty or variability in your measurements. Matplotlib.pyplot.plot_date() function in Python can be combined with errorbar() to achieve this. Here’s an example:
import matplotlib.pyplot as plt
import numpy as np
from datetime import datetime, timedelta

# Generate sample data
start_date = datetime(2023, 1, 1)
days = 30
dates = [start_date + timedelta(days=i) for i in range(days)]
values = np.random.normal(10, 2, days)
errors = np.random.uniform(0.5, 1.5, days)

plt.figure(figsize=(12, 6))
plt.errorbar(dates, values, yerr=errors, fmt='o-', capsize=5)
plt.title('Time Series with Error Bars - how2matplotlib.com')
plt.xlabel('Date')
plt.ylabel('Value')
plt.gcf().autofmt_xdate()
plt.show()
Output:
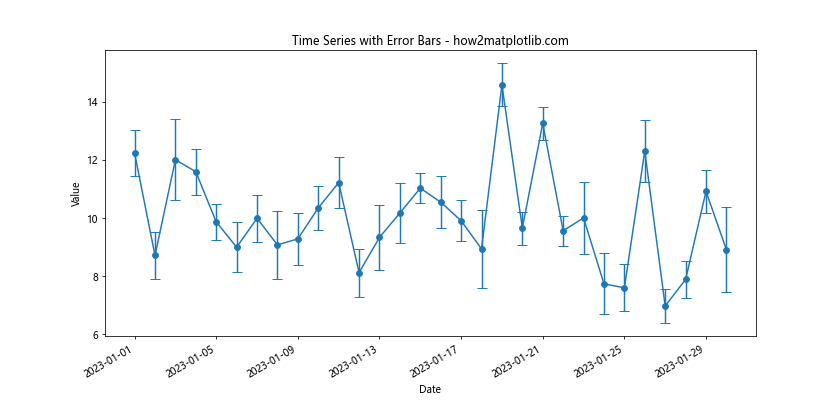
This example adds error bars to each data point in the time series plot.
Creating Stacked Area Plots with Matplotlib.pyplot.plot_date()
Stacked area plots can be useful for visualizing multiple time series that add up to a total. While Matplotlib.pyplot.plot_date() function in Python doesn’t directly create stacked area plots, it can be combined with fill_between() to achieve this effect. Here’s an example:
import matplotlib.pyplot as plt
import numpy as np
from datetime import datetime, timedelta

# Generate sample data
start_date = datetime(2023, 1, 1)
days = 365
dates = [start_date + timedelta(days=i) for i in range(days)]
series1 = np.random.normal(10, 2, days)
series2 = np.random.normal(15, 3, days)
series3 = np.random.normal(20, 4, days)

plt.figure(figsize=(12, 6))
plt.fill_between(dates, 0, series1, label='Series 1')
plt.fill_between(dates, series1, series1+series2, label='Series 2')
plt.fill_between(dates, series1+series2, series1+series2+series3, label='Series 3')

plt.title('Stacked Area Plot - how2matplotlib.com')
plt.xlabel('Date')
plt.ylabel('Value')
plt.legend()
plt.gcf().autofmt_xdate()
plt.show()
Output:
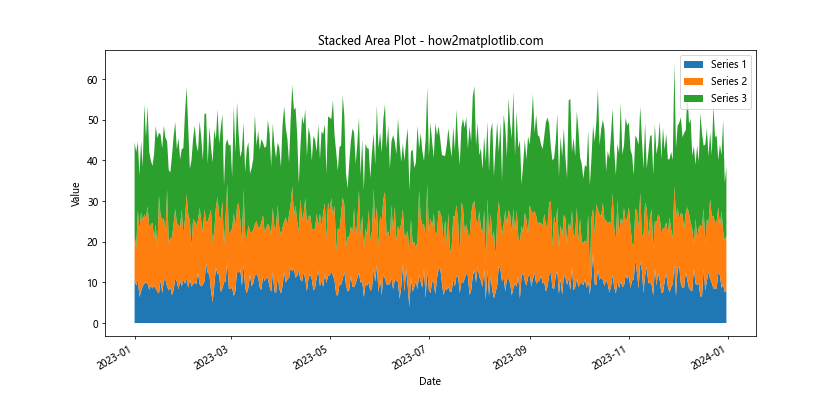
This example creates a stacked area plot with three different series.
Handling Large Datasets with Matplotlib.pyplot.plot_date()
When dealing with large time series datasets, plotting every single point can be computationally expensive and may result in cluttered plots. Matplotlib.pyplot.plot_date() function in Python can be combined with data reduction techniques to handle large datasets efficiently. Here’s an example using data binning:
import matplotlib.pyplot as plt
import numpy as np
from datetime import datetime, timedelta

# Generate a large dataset
start_date = datetime(2023, 1, 1)
days = 1000
dates = [start_date + timedelta(days=i) for i in range(days)]
values = np.cumsum(np.random.normal(0, 1, days))

# Bin the data
bin_size = 10
binned_dates = dates[::bin_size]
binned_values = [np.mean(values[i:i+bin_size]) for i in range(0, len(values), bin_size)]

plt.figure(figsize=(12, 6))
plt.plot_date(binned_dates, binned_values, linestyle='-', marker='')
plt.title('Large Dataset with Binning - how2matplotlib.com')
plt.xlabel('Date')
plt.ylabel('Value')
plt.gcf().autofmt_xdate()
plt.show()
Output:
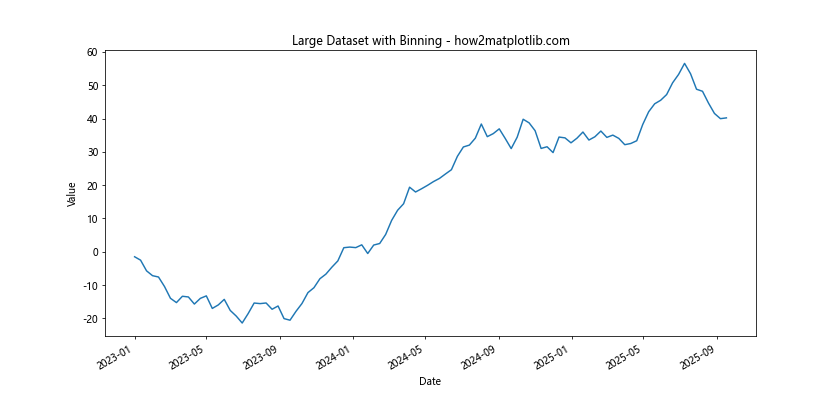
In this example, we’re binning the data by averaging every 10 days, which reduces the number of points plotted while still preserving the overall trend of the data.
Creating Heatmaps with Matplotlib.pyplot.plot_date()
While Matplotlib.pyplot.plot_date() function in Python is primarily used for line plots, it can be combined with other Matplotlib functions to create more complex visualizations like heatmaps. Here’s an example of creating a heatmap for time series data:
import matplotlib.pyplot as plt
import numpy as np
from datetime import datetime, timedelta

# Generate sample data
start_date = datetime(2023, 1, 1)
days = 365
hours = 24
dates = [start_date + timedelta(days=i) for i in range(days)]
hours = range(24)
data = np.random.rand(days, 24)

plt.figure(figsize=(12, 8))
plt.imshow(data.T, aspect='auto', cmap='viridis', extent=[0, len(dates), 0, 24])
plt.colorbar(label='Value')
plt.title('Time Series Heatmap - how2matplotlib.com')
plt.xlabel('Date')
plt.ylabel('Hour')

# Customize x-axis ticks
plt.gca().xaxis_date()
plt.gcf().autofmt_xdate()

plt.show()
Output:
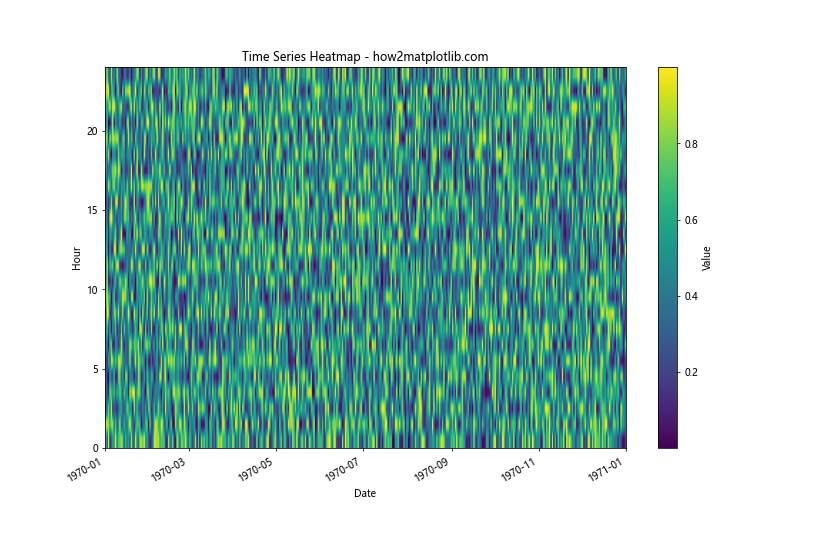
This example creates a heatmap where each cell represents a specific hour on a specific day, with the color indicating the value.
Conclusion
Matplotlib.pyplot.plot_date() function in Python is a versatile tool for visualizing time series data. Throughout this comprehensive guide, we’ve explored various aspects of this function, from basic usage to advanced techniques. We’ve seen how to customize date formatting, handle different time scales, combine multiple time series, add annotations, customize markers and lines, handle missing data, create subplots, add secondary y-axes, customize grid lines, add error bars, create stacked area plots, handle large datasets, and even create heatmaps.
The plot_date() function’s flexibility allows it to be used in a wide range of applications, from financial analysis to scientific research. By leveraging the power of Matplotlib and combining plot_date() with other Matplotlib functions, you can create informative and visually appealing time series visualizations.