Comprehensive Guide to Matplotlib.pyplot.fill() Function in Python
Matplotlib.pyplot.fill() function in Python is a powerful tool for creating filled polygons in data visualization. This versatile function allows you to add color and depth to your plots, making them more visually appealing and informative. In this comprehensive guide, we’ll explore the Matplotlib.pyplot.fill() function in detail, covering its syntax, parameters, and various use cases. We’ll also provide numerous examples to help you master this essential plotting technique.
Understanding the Basics of Matplotlib.pyplot.fill()
The Matplotlib.pyplot.fill() function is part of the pyplot module in Matplotlib, a popular plotting library for Python. This function is used to create filled polygons by connecting a series of points with straight lines and filling the enclosed area with a specified color.
Let’s start with a simple example to demonstrate the basic usage of Matplotlib.pyplot.fill():
import matplotlib.pyplot as plt

x = [0, 1, 2, 1]
y = [0, 1, 0, -1]

plt.fill(x, y, 'r', alpha=0.5)
plt.title('Basic Matplotlib.pyplot.fill() Example - how2matplotlib.com')
plt.xlabel('X-axis')
plt.ylabel('Y-axis')
plt.grid(True)
plt.show()
Output:

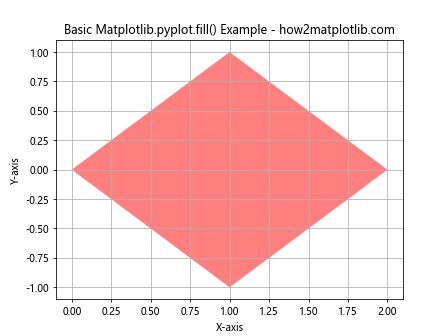
In this example, we create a simple diamond shape using four points. The Matplotlib.pyplot.fill() function takes the x and y coordinates as separate lists, followed by the color (‘r’ for red) and an optional alpha value for transparency. The resulting plot shows a filled red diamond with 50% opacity.
Syntax and Parameters of Matplotlib.pyplot.fill()
The Matplotlib.pyplot.fill() function has the following syntax:
matplotlib.pyplot.fill(*args, data=None, **kwargs)
Let’s break down the parameters:
- *args: These are alternating x and y coordinates of the polygon vertices. You can provide these as separate lists or as a single array-like object.
data: This optional parameter can be used to specify a structured data object that contains the plotting data.
**kwargs: These are additional keyword arguments that control various aspects of the fill, such as color, alpha, and line properties.
Some commonly used keyword arguments include: