Matplotlib Plot Colors
Matplotlib is a widely used visualization library in Python that allows users to create a variety of charts and plots. One key aspect of creating visually appealing plots is choosing appropriate colors. In this article, we will explore different ways to specify colors in Matplotlib plots.
1. Specifying Colors using Color Names
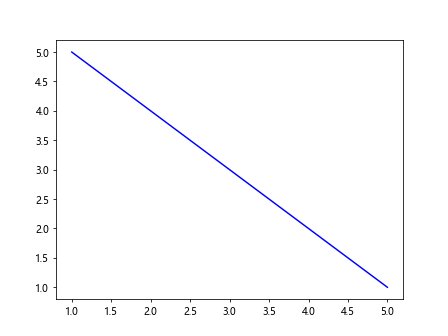
You can specify colors in Matplotlib using a variety of color names. Here are some examples:
import matplotlib.pyplot as plt

x = [1, 2, 3, 4, 5]
y = [5, 4, 3, 2, 1]

plt.plot(x, y, color='blue', label='Blue Line')
plt.show()
Output:
2. Using RGB Values
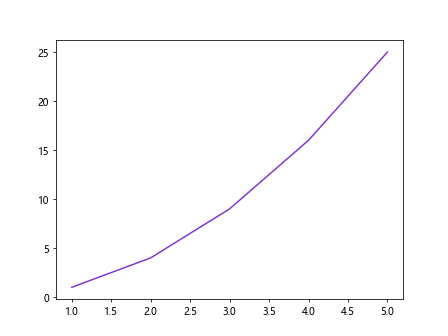
Another way to specify colors in Matplotlib is by using RGB values. Here’s an example:
import matplotlib.pyplot as plt

x = [1, 2, 3, 4, 5]
y = [1, 4, 9, 16, 25]

plt.plot(x, y, color=(0.5, 0.2, 0.8), label='Custom Color')
plt.show()
Output:
3. Using Hexadecimal Codes
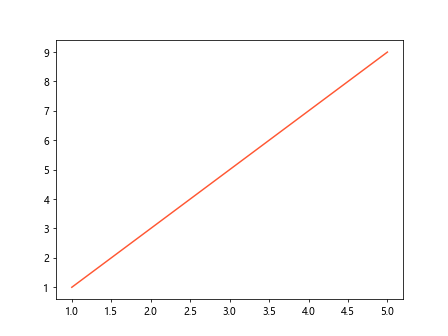
You can also specify colors in Matplotlib using hexadecimal codes. Here’s an example:
import matplotlib.pyplot as plt

x = [1, 2, 3, 4, 5]
y = [1, 3, 5, 7, 9]

plt.plot(x, y, color='#FF5733', label='Custom Color')
plt.show()
Output:
4. Using RGBA Values
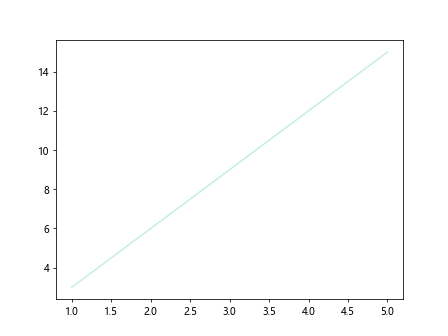
If you want to specify colors with transparency, you can use RGBA values. Here’s an example:
import matplotlib.pyplot as plt

x = [1, 2, 3, 4, 5]
y = [3, 6, 9, 12, 15]

plt.plot(x, y, color=(0.2, 0.8, 0.5, 0.3), label='Transparent Color')
plt.show()
Output:
5. Using Color Names from the ‘xkcd’ Survey
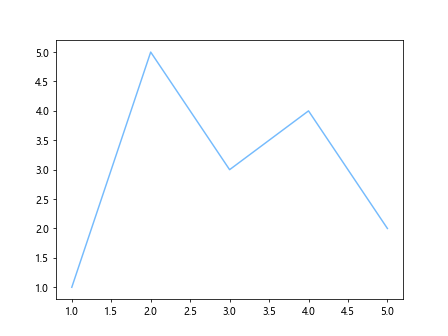
Matplotlib also provides support for using color names from the ‘xkcd’ survey. Here’s an example:
import matplotlib.pyplot as plt

x = [1, 2, 3, 4, 5]
y = [1, 5, 3, 4, 2]

plt.plot(x, y, color='xkcd:sky blue', label='xkcd Color')
plt.show()
Output:
6. Linear Segmented Colormaps
Matplotlib provides a variety of linear segmented colormaps that can be used for plots. Here’s an example of using the ‘viridis’ colormap:
import matplotlib.pyplot as plt

x = [1, 2, 3, 4, 5]
y = [1, 3, 5, 7, 9]
colors = plt.cm.viridis(np.linspace(0, 1, 5))  # Using colormap

for i in range(len(x)):
    plt.bar(x[i], y[i], color=colors[i])

plt.show()
7. Sequential Colormaps
Sequential colormaps are often used for data that has a natural ordering. Here’s an example of using the ‘hot’ colormap:
import matplotlib.pyplot as plt

x = [1, 2, 3, 4, 5]
y = [10, 20, 30, 40, 50]
colors = plt.cm.hot(np.linspace(0, 1, 5))  # Using colormap

plt.bar(x, y, color=colors)
plt.show()
8. Diverging Colormaps
Diverging colormaps are useful for data that has a critical midpoint. Here’s an example of using the ‘coolwarm’ colormap:
import matplotlib.pyplot as plt

x = [1, 2, 3, 4, 5]
y = [5, 10, 15, 20, 25]
colors = plt.cm.coolwarm(np.linspace(0, 1, 5))  # Using colormap

plt.scatter(x, y, color=colors)
plt.show()
9. Qualitative Colormaps
Qualitative colormaps are often used for categorical data. Here’s an example of using the ‘tab10’ colormap:
import matplotlib.pyplot as plt

labels = ['A', 'B', 'C', 'D', 'E']
sizes = [20, 30, 25, 15, 10]
colors = plt.cm.tab10(np.arange(len(sizes)))  # Using colormap

plt.pie(sizes, labels=labels, colors=colors)
plt.show()
10. Customizing Colormaps
You can also create custom colormaps in Matplotlib. Here’s an example of creating a custom colormap with linear interpolation:
import matplotlib.pyplot as plt
import numpy as np

x = np.linspace(0, 10, 100)
y = np.sin(x)

colors = np.column_stack([x, np.zeros_like(x), np.zeros_like(x)])  # Custom colormap

plt.scatter(x, y, c=x, cmap=colors)
plt.colorbar()
plt.show()
In this article, we have explored different ways to specify colors in Matplotlib plots. By choosing the right colors for your plots, you can effectively enhance the visual appeal and convey your data more effectively. Experiment with different color options in Matplotlib to create stunning visualizations for your data analysis projects.