Moving legend in Matplotlib
Matplotlib is a powerful Python library for creating visualizations. One common customization in Matplotlib plots is moving the legend to a different location. In this article, we will explore different ways to move the legend in Matplotlib.
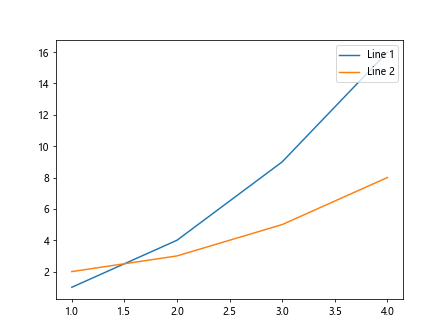
1. Moving the legend to the top right corner
import matplotlib.pyplot as plt

plt.plot([1, 2, 3, 4], [1, 4, 9, 16], label='Line 1')
plt.plot([1, 2, 3, 4], [2, 3, 5, 8], label='Line 2')

plt.legend(loc='upper right')
plt.show()
Output:
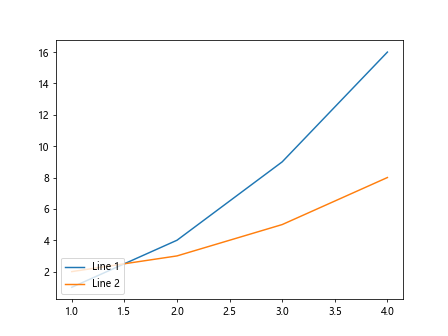
2. Moving the legend to the bottom left corner
import matplotlib.pyplot as plt

plt.plot([1, 2, 3, 4], [1, 4, 9, 16], label='Line 1')
plt.plot([1, 2, 3, 4], [2, 3, 5, 8], label='Line 2')

plt.legend(loc='lower left')
plt.show()
Output:
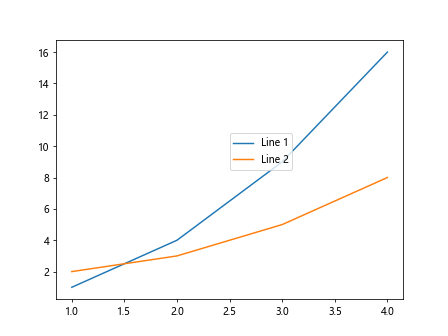
3. Moving the legend to a specific coordinate
import matplotlib.pyplot as plt

plt.plot([1, 2, 3, 4], [1, 4, 9, 16], label='Line 1')
plt.plot([1, 2, 3, 4], [2, 3, 5, 8], label='Line 2')

plt.legend(loc=(0.5, 0.5))
plt.show()
Output:
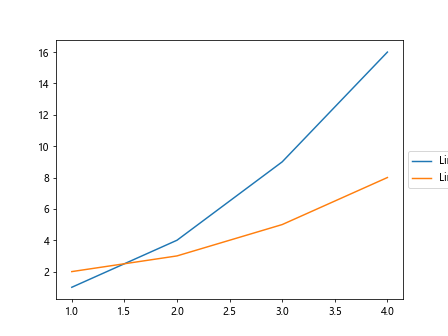
4. Moving the legend outside the plot
import matplotlib.pyplot as plt

plt.plot([1, 2, 3, 4], [1, 4, 9, 16], label='Line 1')
plt.plot([1, 2, 3, 4], [2, 3, 5, 8], label='Line 2')

plt.legend(loc='center left', bbox_to_anchor=(1, 0.5))
plt.show()
Output:
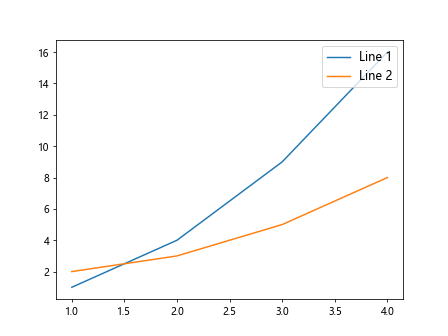
5. Changing the legend font size
import matplotlib.pyplot as plt

plt.plot([1, 2, 3, 4], [1, 4, 9, 16], label='Line 1')
plt.plot([1, 2, 3, 4], [2, 3, 5, 8], label='Line 2')

plt.legend(loc='upper right', fontsize='large')
plt.show()
Output:
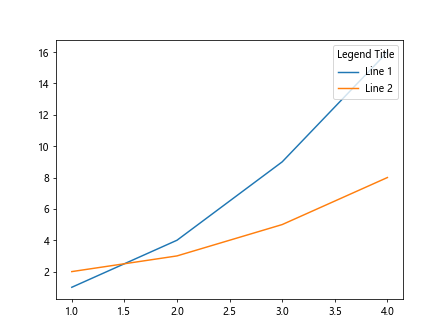
6. Changing the legend title
import matplotlib.pyplot as plt

plt.plot([1, 2, 3, 4], [1, 4, 9, 16], label='Line 1')
plt.plot([1, 2, 3, 4], [2, 3, 5, 8], label='Line 2')

plt.legend(loc='upper right', title='Legend Title')
plt.show()
Output:
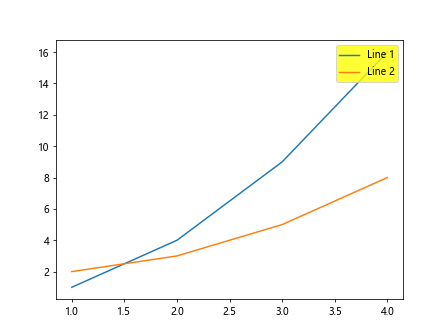
7. Changing the legend color
import matplotlib.pyplot as plt

plt.plot([1, 2, 3, 4], [1, 4, 9, 16], label='Line 1')
plt.plot([1, 2, 3, 4], [2, 3, 5, 8], label='Line 2')

plt.legend(loc='upper right', facecolor='yellow')
plt.show()
Output:
8. Changing the legend border color and width
import matplotlib.pyplot as plt

plt.plot([1, 2, 3, 4], [1, 4, 9, 16], label='Line 1')
plt.plot([1, 2, 3, 4], [2, 3, 5, 8], label='Line 2')

plt.legend(loc='upper right', edgecolor='red', linewidth=2)
plt.show()
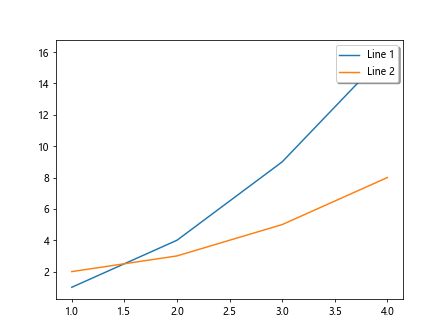
9. Adding shadow to the legend
import matplotlib.pyplot as plt

plt.plot([1, 2, 3, 4], [1, 4, 9, 16], label='Line 1')
plt.plot([1, 2, 3, 4], [2, 3, 5, 8], label='Line 2')

plt.legend(loc='upper right', shadow=True)
plt.show()
Output:
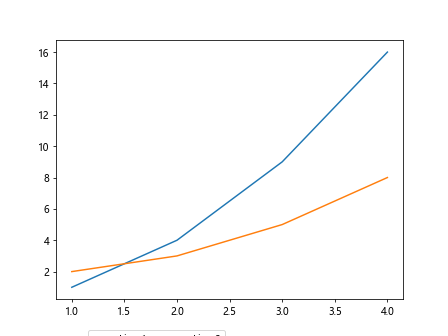
10. Moving the legend horizontally
import matplotlib.pyplot as plt

plt.plot([1, 2, 3, 4], [1, 4, 9, 16], label='Line 1')
plt.plot([1, 2, 3, 4], [2, 3, 5, 8], label='Line 2')

plt.legend(loc='upper right', bbox_to_anchor=(0.5, -0.1), ncol=2)
plt.show()
Output:
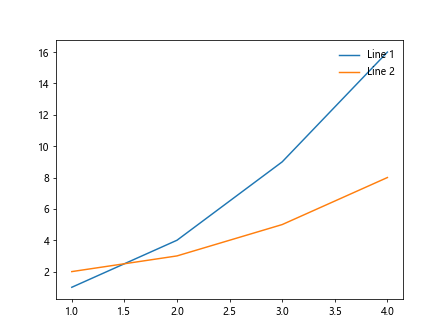
11. Removing the legend frame
import matplotlib.pyplot as plt

plt.plot([1, 2, 3, 4], [1, 4, 9, 16], label='Line 1')
plt.plot([1, 2, 3, 4], [2, 3, 5, 8], label='Line 2')

plt.legend(loc='upper right', frameon=False)
plt.show()
Output:
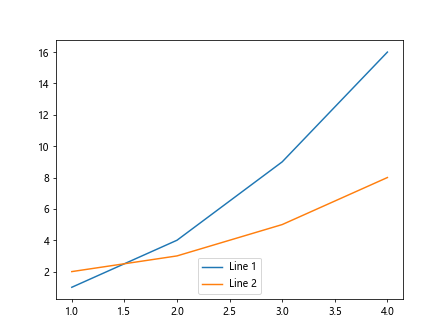
12. Changing the legend alignment
import matplotlib.pyplot as plt

plt.plot([1, 2, 3, 4], [1, 4, 9, 16], label='Line 1')
plt.plot([1, 2, 3, 4], [2, 3, 5, 8], label='Line 2')

plt.legend(loc='lower center')
plt.show()
Output:
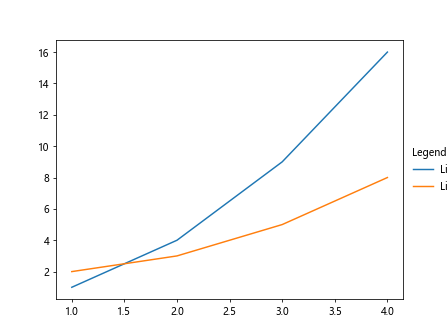
13. Setting the legend to be outside the axes
import matplotlib.pyplot as plt

plt.plot([1, 2, 3, 4], [1, 4, 9, 16], label='Line 1')
plt.plot([1, 2, 3, 4], [2, 3, 5, 8], label='Line 2')

plt.legend(loc='center left', bbox_to_anchor=(1, 0.5), title='Legend Title', frameon=False)
plt.show()
Output:
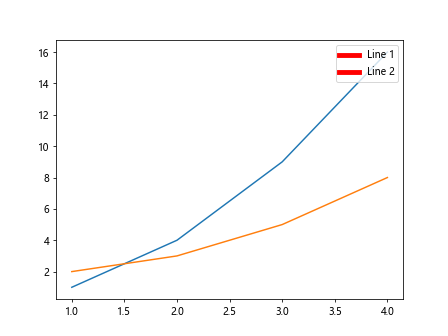
14. Changing the legend labels orientation
import matplotlib.pyplot as plt

plt.plot([1, 2, 3, 4], [1, 4, 9, 16], label='Line 1')
plt.plot([1, 2, 3, 4], [2, 3, 5, 8], label='Line 2')

leg = plt.legend(loc='upper right')
for line in leg.get_lines():
    line.set_linewidth(5)
    line.set_color('red')

plt.show()
Output:
15. Reversing the order of legend entries
import matplotlib.pyplot as plt

plt.plot([1, 2, 3, 4], [1, 4, 9, 16], label='Line 1')
plt.plot([1, 2, 3, 4], [2, 3, 5, 8], label='Line 2')

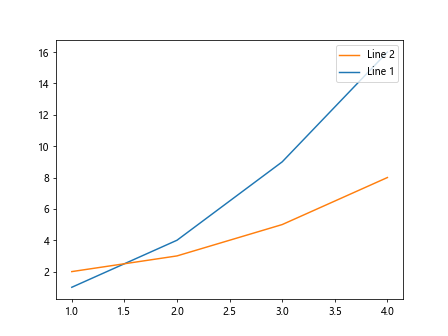
handles, labels = plt.gca().get_legend_handles_labels()
plt.legend(reversed(handles), reversed(labels), loc='upper right')
plt.show()
Output:
16. Moving multiple legends to different locations
import matplotlib.pyplot as plt

plt.plot([1, 2, 3, 4], [1, 4, 9, 16], label='Line 1')
plt.plot([1, 2, 3, 4], [2, 3, 5, 8], label='Line 2')

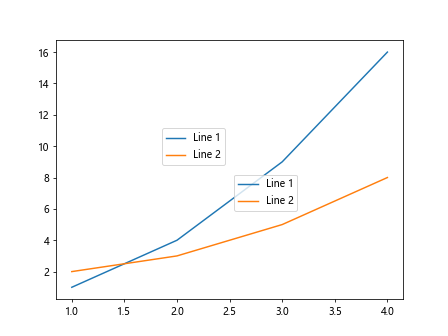
leg1 = plt.legend(loc='upper left', bbox_to_anchor=(0.5, 0.5))
leg2 = plt.legend(loc='lower right', bbox_to_anchor=(0.5, 0.5))
plt.gca().add_artist(leg1)
plt.show()
Output:
17. Customizing legend symbols
import matplotlib.pyplot as plt

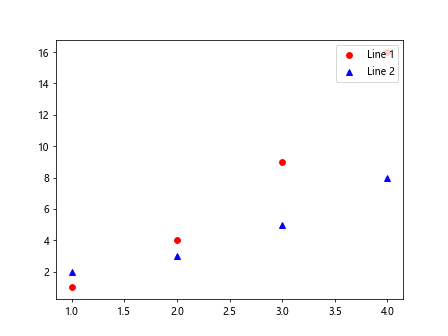
plt.plot([1, 2, 3, 4], [1, 4, 9, 16], 'ro', label='Line 1')
plt.plot([1, 2, 3, 4], [2, 3, 5, 8], 'b^', label='Line 2')

plt.legend(loc='upper right')
plt.show()
Output:
18. Changing the legend title font size and color
import matplotlib.pyplot as plt

plt.plot([1, 2, 3, 4], [1, 4, 9, 16], label='Line 1')
plt.plot([1, 2, 3, 4], [2, 3, 5, 8], label='Line 2')

plt.legend(loc='upper right', title='Legend Title', title_fontsize='large', title_color='green')
plt.show()
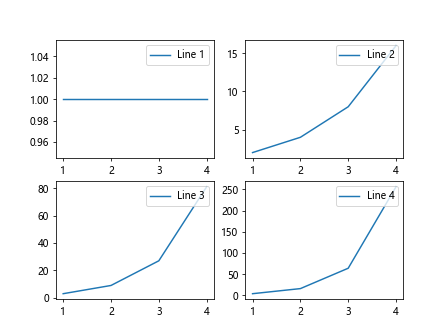
19. Moving legend across subplots in a figure
import matplotlib.pyplot as plt

fig, axs = plt.subplots(2, 2)

for i, ax in enumerate(axs.flat, start=1):
    ax.plot([1, 2, 3, 4], [i, i**2, i**3, i**4], label=f'Line {i}')
    ax.legend(loc='upper right')

plt.show()
Output:
20. Overlapping legends on a plot
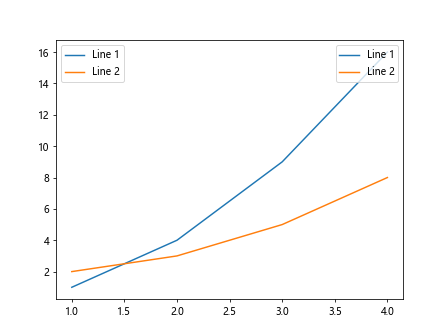
import matplotlib.pyplot as plt

plt.plot([1, 2, 3, 4], [1, 4, 9, 16], label='Line 1')
plt.plot([1, 2, 3, 4], [2, 3, 5, 8], label='Line 2')

leg1 = plt.legend(loc='upper right')
leg2 = plt.legend(loc='upper left')
plt.gca().add_artist(leg1)
plt.show()
Output:
In this article, we have explored various ways to customize and move the legend in Matplotlib plots. By using these techniques, you can create visually appealing and informative plots that effectively communicate your data. Experiment with different legend placements and styles to find the best representation for your plots.