Matplotlib Markersize
Matplotlib is a powerful Python library for creating static, animated, and interactive visualizations in Python. When creating scatter plots or line plots using Matplotlib, markersize refers to the size of the markers used to represent data points.
In this article, we will explore how to adjust the markersize in Matplotlib to customize the appearance of our plots.
Setting Markersize in Scatter Plot
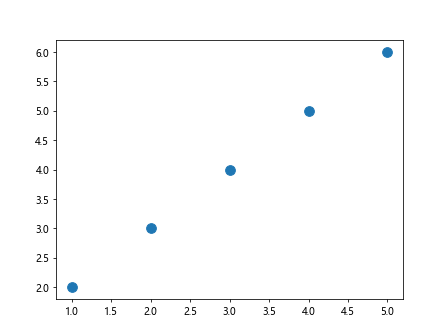
In a scatter plot, markersize determines the size of the markers used to represent each data point. The markersize can be adjusted by specifying the s parameter in the scatter function.
import matplotlib.pyplot as plt

x = [1, 2, 3, 4, 5]
y = [2, 3, 4, 5, 6]

plt.scatter(x, y, s=100) # Set markersize to 100
plt.show()
Output:
Changing Markersize in Line Plot
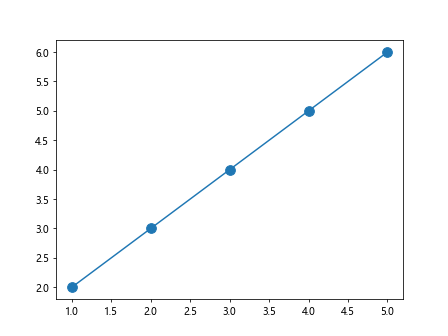
In a line plot, markersize determines the size of the markers placed along the line at each data point. The markersize can be adjusted by specifying the markersize parameter in the plot function.
import matplotlib.pyplot as plt

x = [1, 2, 3, 4, 5]
y = [2, 3, 4, 5, 6]

plt.plot(x, y, marker='o', markersize=10) # Set markersize to 10
plt.show()
Output:
Varying Marker Size Based on Data
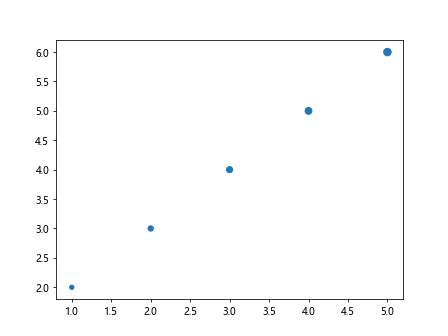
Sometimes, we may want to vary the markersize based on the data being plotted. This can be achieved by passing an array of sizes to the s parameter in the scatter function.
import matplotlib.pyplot as plt

x = [1, 2, 3, 4, 5]
y = [2, 3, 4, 5, 6]
sizes = [20, 30, 40, 50, 60]

plt.scatter(x, y, s=sizes) # Set markersizes based on the `sizes` array
plt.show()
Output:
Customizing Markersize for Categorical Data
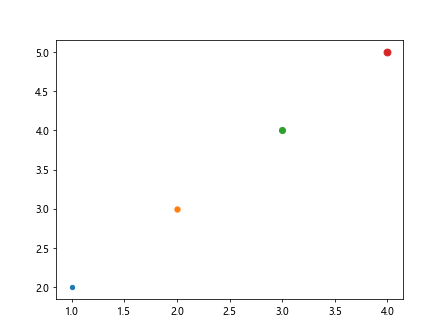
When working with categorical data, we may want to use different markersizes for different categories. This can be achieved by creating a dictionary that maps categories to markersizes and then using this dictionary to set the markersizes.
import matplotlib.pyplot as plt

categories = ['A', 'B', 'C', 'D']
x = [1, 2, 3, 4]
y = [2, 3, 4, 5]
sizes = {'A': 20, 'B': 30, 'C': 40, 'D': 50}

for i, category in enumerate(categories):
    plt.scatter(x[i], y[i], s=sizes[category])

plt.show()
Output:
Adjusting Markersize in Subplots
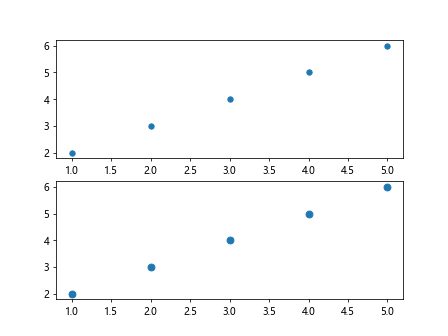
When working with subplots in Matplotlib, we can adjust the markersize for each subplot independently by specifying the markersize for each subplot.
import matplotlib.pyplot as plt

fig, axs = plt.subplots(2)

x1 = [1, 2, 3, 4, 5]
y1 = [2, 3, 4, 5, 6]

x2 = [5, 4, 3, 2, 1]
y2 = [6, 5, 4, 3, 2]

axs[0].scatter(x1, y1, s=30) # Set markersize for subplot 1
axs[1].scatter(x2, y2, s=50) # Set markersize for subplot 2

plt.show()
Output:
Using Markersize with Different Marker Styles
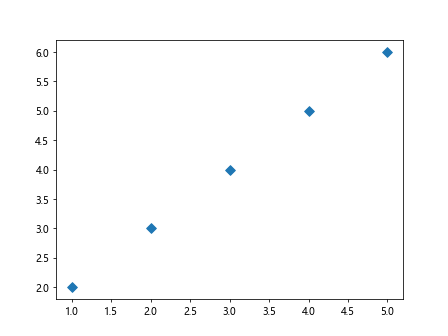
In Matplotlib, markersize can be used in combination with different marker styles to create visually appealing plots. Marker styles can be specified using the marker parameter in the scatter or plot functions.
import matplotlib.pyplot as plt

x = [1, 2, 3, 4, 5]
y = [2, 3, 4, 5, 6]

plt.scatter(x, y, marker='D', s=50) # Use diamond markers with markersize 50
plt.show()
Output:
Changing Markersize for Specific Data Points
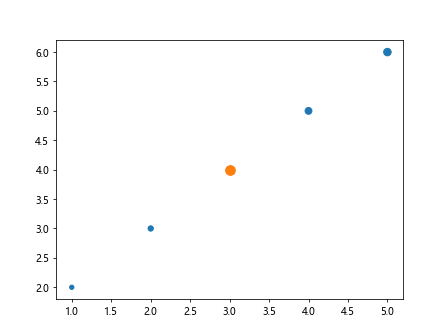
There may be cases where we want to change the markersize for specific data points in a plot. This can be achieved by passing an array of sizes to the s parameter in the scatter function and setting the markersize for the desired data points.
import matplotlib.pyplot as plt

x = [1, 2, 3, 4, 5]
y = [2, 3, 4, 5, 6]
sizes = [20, 30, 40, 50, 60]

plt.scatter(x, y, s=sizes)

# Change markersize for specific data points
plt.scatter(x[2], y[2], s=100) # Set markersize to 100 for the third data point
plt.show()
Output:
Adjusting Markersize Using Keywords
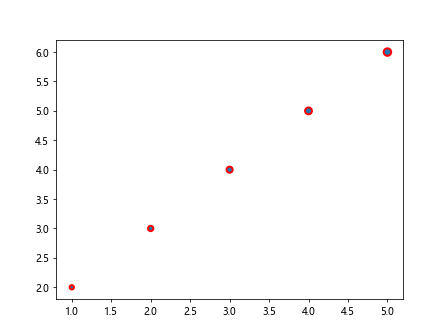
In addition to specifying the markersize directly, we can also adjust the markersize using keywords in the scatter or plot functions. Some of the keywords that can be used to adjust markersize include linewidths, edgecolors, and facecolors. These keywords allow for more customization options when setting markersize.
import matplotlib.pyplot as plt

x = [1, 2, 3, 4, 5]
y = [2, 3, 4, 5, 6]
sizes = [20, 30, 40, 50, 60]

plt.scatter(x, y, s=sizes, linewidths=2, edgecolors='r') # Set linewidth and edge color
plt.show()
Output:
Adjusting Markersize in 3D Plots
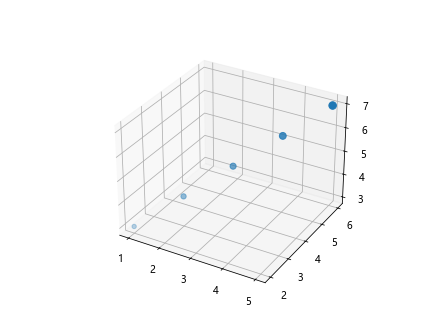
In 3D plots, markersize can be adjusted using the s parameter in the scatter function. The markersize in 3D plots determines the size of the markers used to represent data points in the plot.
import matplotlib.pyplot as plt
from mpl_toolkits.mplot3d import Axes3D

fig = plt.figure()
ax = fig.add_subplot(111, projection='3d')

x = [1, 2, 3, 4, 5]
y = [2, 3, 4, 5, 6]
z = [3, 4, 5, 6, 7]
sizes = [20, 30, 40, 50, 60]

ax.scatter(x, y, z, s=sizes) # Set markersize in 3D plot
plt.show()
Output:
Conclusion
In this article, we have explored how to adjust the markersize in Matplotlib to customize the appearance of scatter plots and line plots. By understanding how to set markersize, vary markersize based on data, customize markersize for categorical data, and use markersize with different marker styles, you can create visually appealing plots tailored to your specific needs. Experiment with the examples provided and explore the various options available for adjusting markersize in Matplotlib.