Matplotlib Plot Line Thickness
In this article, we will explore how to adjust the line thickness when plotting in Matplotlib. Adjusting the line thickness can help emphasize certain parts of the plot or simply make the plot more visually appealing.
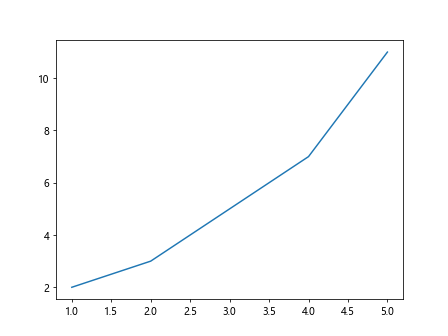
Basic Line Plot with Default Thickness
Let’s start by creating a basic line plot with the default line thickness.
import matplotlib.pyplot as plt

x = [1, 2, 3, 4, 5]
y = [2, 3, 5, 7, 11]

plt.plot(x, y)
plt.show()
Output:
Changing Line Thickness
We can adjust the line thickness by setting the linewidth parameter in the plot() function.
import matplotlib.pyplot as plt

x = [1, 2, 3, 4, 5]
y = [2, 3, 5, 7, 11]

plt.plot(x, y, linewidth=2)
plt.show()
Output:
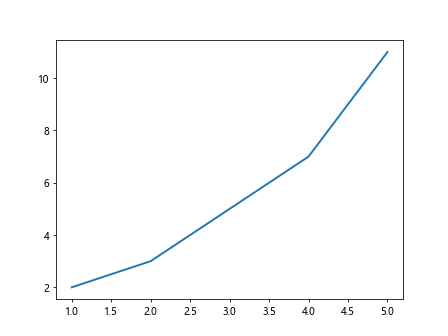
In this example, we have set the line thickness to 2.
Line Thickness with Different Styles
Matplotlib also allows us to set different line styles, such as solid, dashed, or dotted, along with line thickness.
import matplotlib.pyplot as plt

x = [1, 2, 3, 4, 5]
y = [2, 3, 5, 7, 11]

plt.plot(x, y, linestyle='--', linewidth=1)
plt.plot(x, [3, 6, 9, 12, 15], linestyle=':', linewidth=2)
plt.plot(x, [1, 4, 7, 10, 13], linestyle='-.', linewidth=3)
plt.show()
Output:
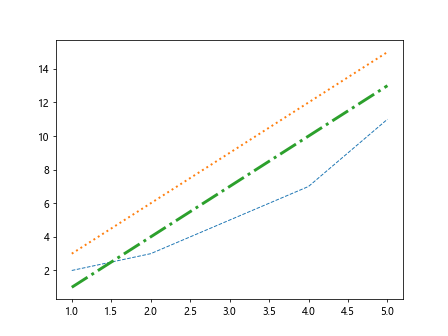
In this example, we have set different line styles and thickness for each plot.
Changing Line Thickness for Scatter Plots
We can also adjust the line thickness when creating scatter plots in Matplotlib.
import matplotlib.pyplot as plt

x = [1, 2, 3, 4, 5]
y = [2, 3, 5, 7, 11]

plt.scatter(x, y, s=100, linewidths=2)
plt.show()
Output:
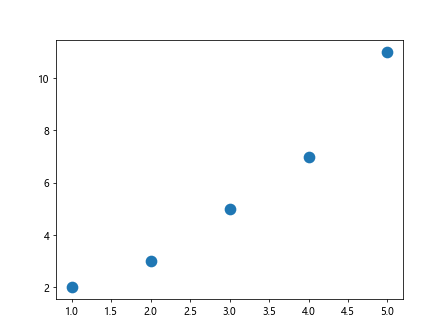
In this example, we have set the line thickness for the markers in the scatter plot to 2.
Line Thickness in Subplots
When working with subplots, we can customize the line thickness for each subplot.
import matplotlib.pyplot as plt

x = [1, 2, 3, 4, 5]
y = [2, 3, 5, 7, 11]

fig, axs = plt.subplots(2)

axs[0].plot(x, y, linewidth=1)
axs[1].plot(x, [1, 4, 9, 16, 25], linewidth=2)

plt.show()
Output:
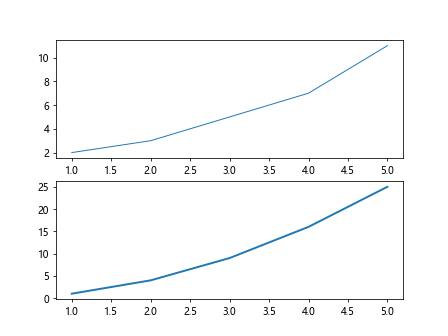
In this example, we have created two subplots with different line thickness.
Changing Line Thickness in 3D Plots
For 3D plots, we can also adjust the line thickness using the linewidth parameter.
from mpl_toolkits.mplot3d import Axes3D
import matplotlib.pyplot as plt

x = [1, 2, 3, 4, 5]
y = [2, 3, 5, 7, 11]

fig = plt.figure()
ax = fig.add_subplot(111, projection='3d')

x = [1, 2, 3, 4, 5]
y = [2, 3, 5, 7, 11]
z = [0, 1, 4, 9, 16]

ax.plot(x, y, z, linewidth=2)

plt.show()
Output:
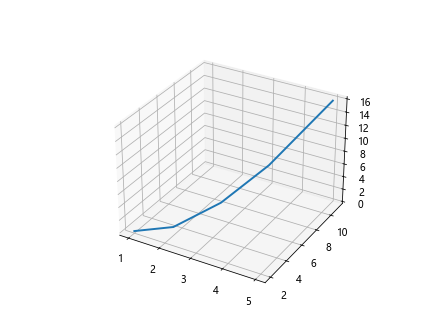
In this example, we have set the line thickness for the 3D plot to 2.
Line Thickness in Bar Plots
Bar plots can also have adjustable line thickness around the bars.
import matplotlib.pyplot as plt

x = [1, 2, 3, 4, 5]
y = [2, 3, 5, 7, 11]

plt.bar(x, y, linewidth=2)
plt.show()
Output:
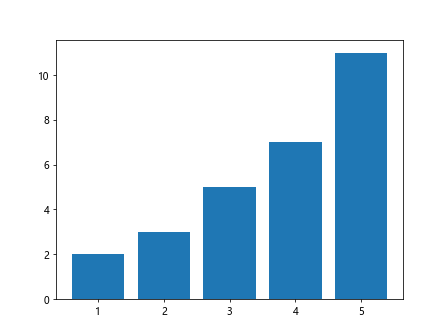
In this example, we have set the line thickness around the bars to 2.
Customizing Line Thickness with Color
We can combine line thickness adjustments with different colors to create visually appealing plots.
import matplotlib.pyplot as plt

x = [1, 2, 3, 4, 5]
y = [2, 3, 5, 7, 11]

plt.plot(x, y, color='red', linewidth=2)
plt.plot(x, [3, 6, 9, 12, 15], color='blue', linewidth=2)
plt.show()
Output:
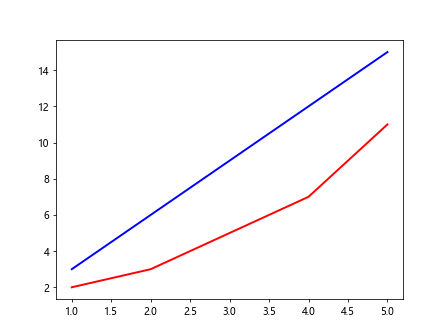
In this example, we have customized the line colors along with the thickness.
Line Thickness in Polar Plots
For polar plots, we can also adjust the line thickness of the plot.
import numpy as np
import matplotlib.pyplot as plt

x = [1, 2, 3, 4, 5]
y = [2, 3, 5, 7, 11]

r = np.array([1, 2, 3, 4, 5])
theta = np.array([0, np.pi/2, np.pi, 3*np.pi/2, 2*np.pi])

plt.polar(theta, r, linewidth=2)
plt.show()
Output:
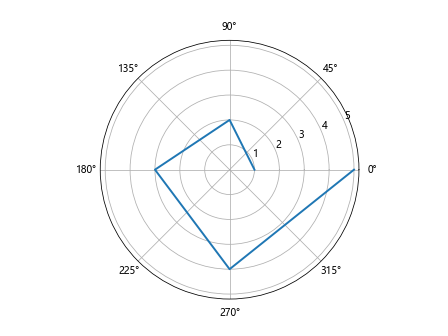
In this example, we have set the line thickness for the polar plot to 2.
Line Thickness for Error Bars
We can adjust the line thickness of error bars in Matplotlib plots.
import matplotlib.pyplot as plt

x = [1, 2, 3, 4, 5]
y = [2, 3, 5, 7, 11]

plt.errorbar(x, y, yerr=0.5, linewidth=2)
plt.show()
Output:
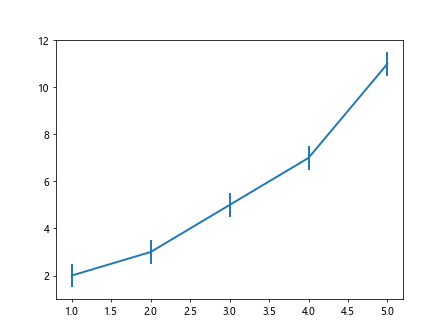
In this example, we have set the line thickness for the error bars to 2.
Summary
In this article, we have explored how to adjust the line thickness when plotting in Matplotlib. We have covered basic line plots, line thickness with different styles, scatter plots, subplots, 3D plots, bar plots, customizing line thickness with color, polar plots, and error bars. Adjusting the line thickness can enhance the visual appeal of plots and provide emphasis on specific data points. Experiment with different line thickness settings to create visually stunning plots in Matplotlib.
Remember, the key is to strike a balance between line thickness and other plot elements to ensure readability and clarity in your visualizations.