Using Log Scale in Matplotlib Plots
Matplotlib is a popular data visualization library in Python, known for its flexibility and extensive customization options. One common feature used in plotting is the log scale, which is especially useful when dealing with data that spans several orders of magnitude. In this article, we will explore how to use log scale in Matplotlib plots and provide detailed examples.
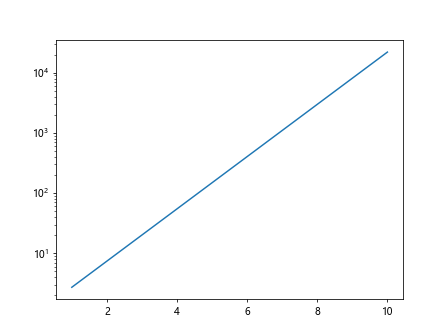
1. Basic Line Plot with Log Scale
import matplotlib.pyplot as plt
import numpy as np

x = np.linspace(1, 10, 100)
y = np.exp(x)

plt.figure()
plt.plot(x, y)
plt.yscale('log')
plt.show()
Output:
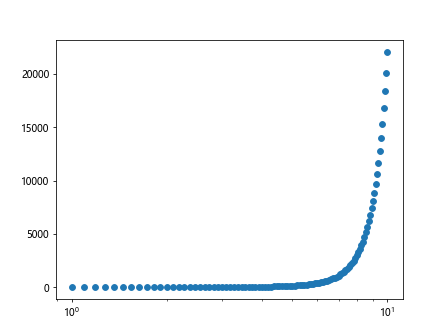
2. Scatter Plot with Log Scale
import matplotlib.pyplot as plt
import numpy as np

x = np.linspace(1, 10, 100)
y = np.exp(x)

plt.figure()
plt.scatter(x, y)
plt.xscale('log')
plt.show()
Output:
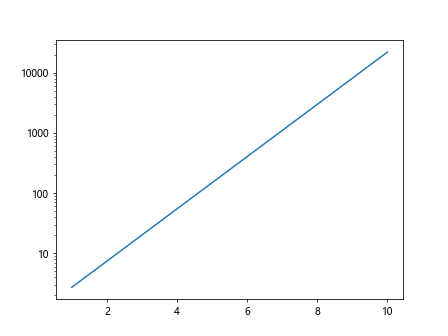
3. Customizing Log Scale Ticks
import matplotlib.pyplot as plt
import numpy as np

x = np.linspace(1, 10, 100)
y = np.exp(x)

plt.figure()
plt.plot(x, y)
plt.yscale('log')
plt.gca().yaxis.set_major_formatter(plt.ScalarFormatter())
plt.show()
Output:
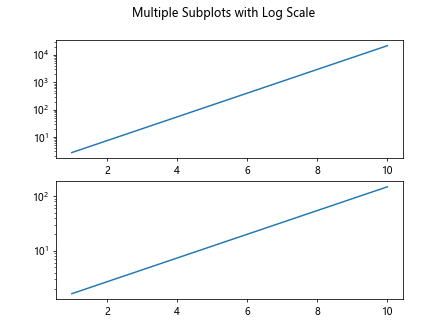
4. Multiple Subplots with Log Scale
import matplotlib.pyplot as plt
import numpy as np

x = np.linspace(1, 10, 100)
y1 = np.exp(x)
y2 = np.exp(0.5 * x)

fig, axs = plt.subplots(2)
fig.suptitle('Multiple Subplots with Log Scale')
axs[0].plot(x, y1)
axs[0].set_yscale('log')
axs[1].plot(x, y2)
axs[1].set_yscale('log')
plt.show()
Output:
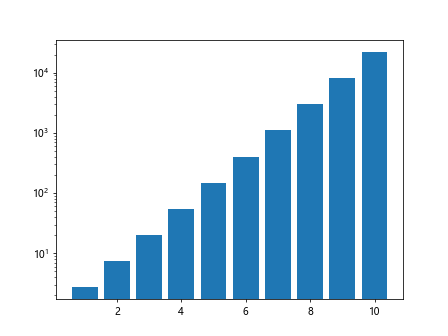
5. Bar Plot with Log Scale
import matplotlib.pyplot as plt
import numpy as np

x = np.arange(1, 11)
y = np.exp(x)

plt.figure()
plt.bar(x, y)
plt.yscale('log')
plt.show()
Output:
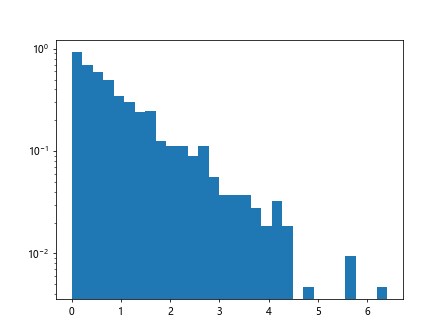
6. Histogram with Log Scale
import matplotlib.pyplot as plt
import numpy as np

data = np.random.exponential(scale=1, size=1000)

plt.figure()
plt.hist(data, bins=30, density=True)
plt.yscale('log')
plt.show()
Output:
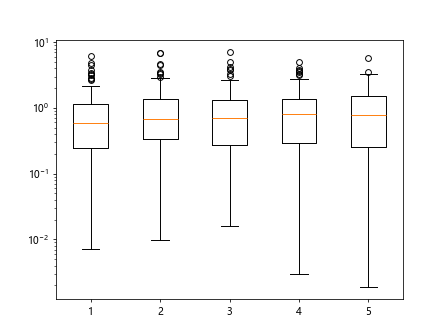
7. Box Plot with Log Scale
import matplotlib.pyplot as plt
import numpy as np

data = [np.random.exponential(scale=1, size=100) for _ in range(5)]

plt.figure()
plt.boxplot(data)
plt.yscale('log')
plt.show()
Output:
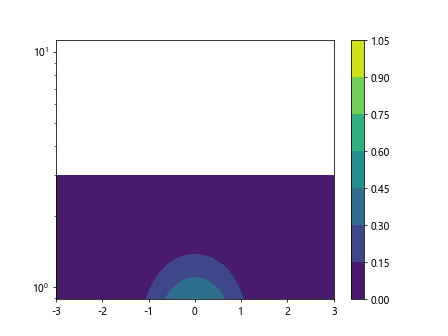
8. Contour Plot with Log Scale
import matplotlib.pyplot as plt
import numpy as np

x = np.linspace(-3, 3, 100)
y = np.linspace(-3, 3, 100)
X, Y = np.meshgrid(x, y)
Z = np.exp(-(X**2 + Y**2))

plt.figure()
plt.contourf(X, Y, Z)
plt.yscale('log')
plt.colorbar()
plt.show()
Output:
9. Heatmap with Log Scale
import matplotlib.pyplot as plt
import seaborn as sns
import numpy as np

data = np.random.rand(10, 10)

plt.figure()
sns.heatmap(data, annot=True, fmt="0.2f", cbar_kws={'format': '%0.2f'})
plt.yscale('log')
plt.show()
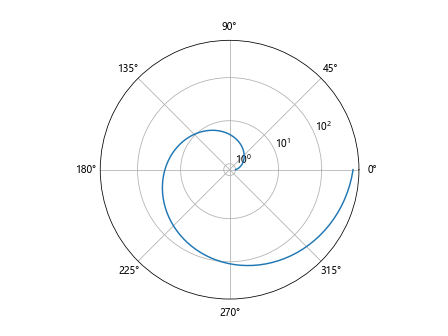
10. Polar Plot with Log Scale
import matplotlib.pyplot as plt
import numpy as np

theta = np.linspace(0, 2*np.pi, 100)
r = np.exp(theta)

plt.figure()
plt.polar(theta, r)
plt.yscale('log')
plt.show()
Output:
Conclusion
In this article, we have explored how to use log scale in Matplotlib plots. By setting the scale to logarithmic, we can effectively visualize data that spans a wide range of values. Whether it is a simple line plot, scatter plot, or more complex plots like histograms and heatmaps, Matplotlib provides the flexibility to customize the log scale for various types of plots. Experiment with different plot types and log scale configurations to effectively communicate your data insights.