Matplotlib Plot Linewidth
Matplotlib is a powerful plotting library for Python that is widely used for creating visualizations. One of the key features of Matplotlib is the ability to customize the appearance of plots in a variety of ways, including changing the linewidth of lines in a plot. In this article, we will explore how to set the linewidth of lines in Matplotlib plots.
Basic Line Plot with Default Linewidth
Let’s start by creating a basic line plot using Matplotlib with the default linewidth. Below is a simple example of how to create a line plot with Matplotlib:
import matplotlib.pyplot as plt
import numpy as np

x = np.linspace(0, 10, 100)
y = np.sin(x)

plt.plot(x, y)
plt.show()
Output:

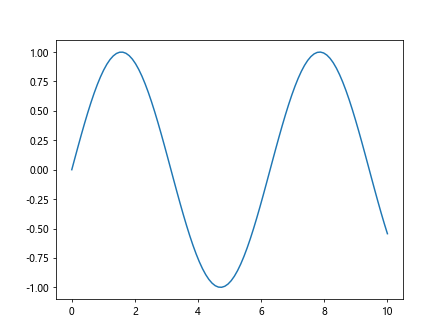
In the above code snippet, we create an array of x values using np.linspace and calculate the corresponding y values using the sine function. We use plt.plot to create a line plot and plt.show to display the plot. By default, the linewidth of the line in the plot is set to 1.5.
Customizing Linewidth in Matplotlib Plots
To change the linewidth of lines in Matplotlib plots, we can use the linewidth or lw parameter in the plt.plot function. The linewidth can be specified as a floating-point number that represents the width of the line in points. Let’s see an example of how to customize the linewidth in a Matplotlib plot:
import matplotlib.pyplot as plt
import numpy as np

x = np.linspace(0, 10, 100)
y = np.sin(x)

plt.plot(x, y, linewidth=2.0)
plt.show()
Output:

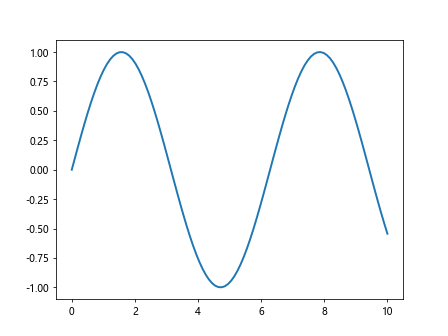
In the above code snippet, we set the linewidth of the line to 2.0 using the linewidth parameter. This will result in a plot where the line is thicker compared to the default linewidth.
Changing Linewidth for Specific Lines
In plots with multiple lines, we can customize the linewidth for each individual line by passing a list of linewidth values to the linewidth parameter. Each value in the list corresponds to the linewidth of a specific line in the plot. Let’s see an example:
import matplotlib.pyplot as plt
import numpy as np

x = np.linspace(0, 10, 100)
y = np.sin(x)

y2 = np.cos(x)

plt.plot(x, y, x, y2, linewidth=[2.0, 1.5])
plt.show()
In the above code snippet, we create a second set of y values using the cosine function and plot both the sine and cosine functions on the same plot. By passing a list [2.0, 1.5] to the linewidth parameter, we set the linewidth of the first line to 2.0 and the linewidth of the second line to 1.5.
Using Line Styles with Custom Linewidths
In addition to customizing the linewidth of lines in Matplotlib plots, we can also specify different line styles such as solid, dashed, or dotted lines. Line styles can be combined with custom linewidths to create visually appealing plots. Let’s see an example of how to use line styles with custom linewidths in Matplotlib:
import matplotlib.pyplot as plt
import numpy as np

x = np.linspace(0, 10, 100)
y = np.sin(x)

plt.plot(x, y, linestyle='--', linewidth=2.0)  # Dashed line with linewidth 2.0
plt.plot(x, y2, linestyle=':', linewidth=1.5)  # Dotted line with linewidth 1.5
plt.show()
In the above code snippet, we use the linestyle parameter to specify dashed and dotted lines for the sine and cosine functions, respectively. By combining line styles with custom linewidths, we can create plots with different visual effects.
Changing Default Linewidth Globally
We can also change the default linewidth for all lines in Matplotlib plots by using the plt.rcParams dictionary. By updating the value of the ‘lines.linewidth’ key in the plt.rcParams dictionary, we can set a new default linewidth for all plots. Let’s see how to change the default linewidth globally in Matplotlib:
import matplotlib.pyplot as plt
import numpy as np

x = np.linspace(0, 10, 100)
y = np.sin(x)

plt.rcParams['lines.linewidth'] = 2.0

plt.plot(x, y)
plt.show()
Output:

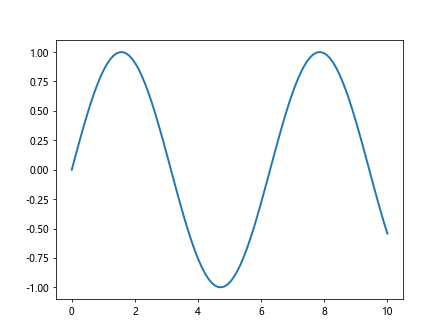
In the above code snippet, we set the default linewidth for all lines in Matplotlib plots to 2.0 by updating the ‘lines.linewidth’ key in the plt.rcParams dictionary. This means that any subsequent plots will use the new default linewidth unless specified otherwise.
Conclusion
In this article, we have explored how to customize the linewidth of lines in Matplotlib plots. We have learned how to set custom linewidths for individual lines, use line styles with custom linewidths, and change the default linewidth globally. By understanding how to customize linewidths in Matplotlib plots, you can create more visually appealing and informative visualizations for your data. Experiment with different linewidths and line styles to find the combination that best suits your needs.