Matplotlib Plot Line Width
Matplotlib is a popular data visualization library in Python. One commonly used feature in matplotlib is the ability to control the line width when plotting lines. In this article, we will explore how to adjust the line width when creating plots using matplotlib.
Setting Line Width
You can set the line width when plotting lines using the linewidth or lw parameter. The line width value is a float that represents the width of the line in points. Let’s see some examples of setting line width in matplotlib plots:
import matplotlib.pyplot as plt

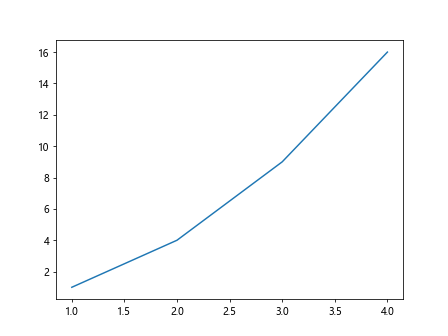
# Example 1: Set line width to 1.5
plt.plot([1, 2, 3, 4], [1, 4, 9, 16], linewidth=1.5)
plt.show()
Output:
import matplotlib.pyplot as plt

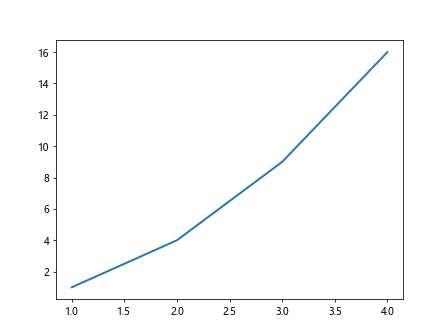
# Example 2: Set line width to 2.0 using lw parameter
plt.plot([1, 2, 3, 4], [1, 4, 9, 16], lw=2.0)
plt.show()
Output:
Line Width Styles
In addition to setting a specific line width, matplotlib also allows you to customize the line width style. You can use the linestyle parameter along with the line width to create different line width styles. Let’s see some examples:
import matplotlib.pyplot as plt

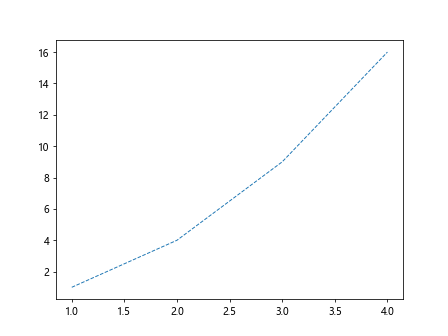
# Example 3: Set line width to 1.0 and style to dashed
plt.plot([1, 2, 3, 4], [1, 4, 9, 16], linewidth=1.0, linestyle='--')
plt.show()
Output:
import matplotlib.pyplot as plt

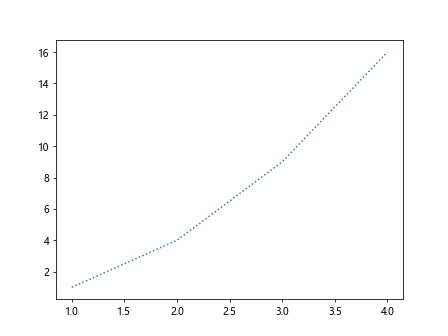
# Example 4: Set line width to 1.5 and style to dotted
plt.plot([1, 2, 3, 4], [1, 4, 9, 16], lw=1.5, ls=':')
plt.show()
Output:
Line Width Colors
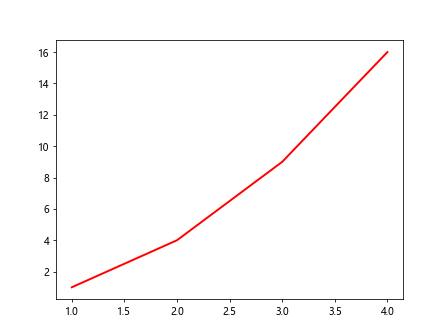
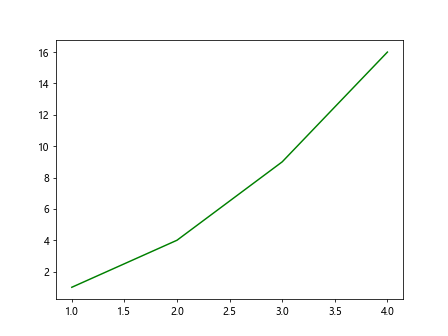
You can also set the line color along with the line width in matplotlib plots. The color parameter is used to specify the line color. Let’s see some examples of setting line width and color:
import matplotlib.pyplot as plt

# Example 5: Set line width to 2.0 and color to red
plt.plot([1, 2, 3, 4], [1, 4, 9, 16], lw=2.0, color='red')
plt.show()
Output:
import matplotlib.pyplot as plt

# Example 6: Set line width to 1.5 and color to green
plt.plot([1, 2, 3, 4], [1, 4, 9, 16], linewidth=1.5, c='green')
plt.show()
Output:
Line Width for Multiple Lines
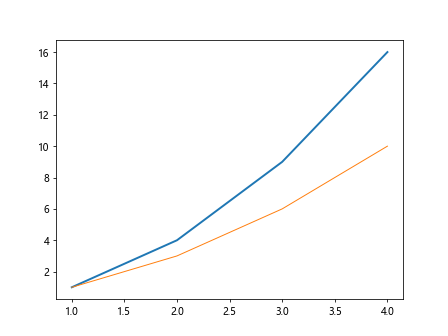
When plotting multiple lines on the same plot, you can set individual line widths for each line. The line width can be specified as a list of values, with each value corresponding to a line. Let’s see an example:
import matplotlib.pyplot as plt

x = [1, 2, 3, 4]
y1 = [1, 4, 9, 16]
y2 = [1, 3, 6, 10]

# Example 7: Set line width for each line
plt.plot(x, y1, lw=2.0)
plt.plot(x, y2, lw=1.0)
plt.show()
Output:
Using Line Width in Different Plot Types
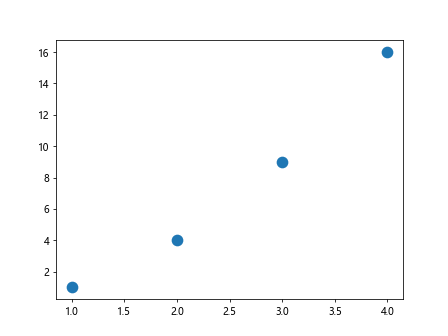
Line width can be used in various plot types in matplotlib, including scatter plots and bar plots. Let’s see examples of using line width in different plot types:
Scatter Plot
import matplotlib.pyplot as plt

# Example 8: Setting line width in scatter plot
plt.scatter([1, 2, 3, 4], [1, 4, 9, 16], s=100, linewidth=2.0)
plt.show()
Output:
Bar Plot
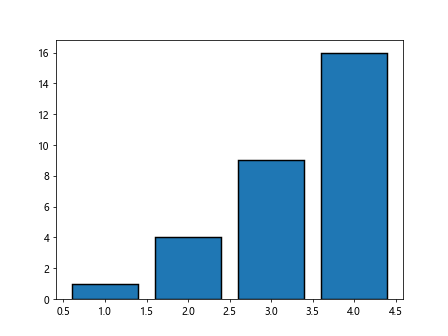
import matplotlib.pyplot as plt

# Example 9: Setting line width in bar plot
plt.bar([1, 2, 3, 4], [1, 4, 9, 16], width=0.8, linewidth=1.5, edgecolor='black')
plt.show()
Output:
Line Width in Subplots
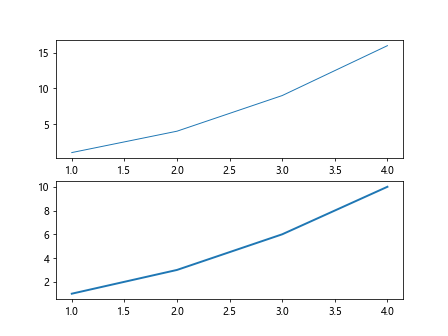
When creating subplots in matplotlib, you can adjust the line width separately for each subplot. Let’s see an example of setting line width in subplots:
import matplotlib.pyplot as plt

fig, ax = plt.subplots(2)

# Example 10: Set line width in subplot 1
ax[0].plot([1, 2, 3, 4], [1, 4, 9, 16], lw=1.0)

# Example 11: Set line width in subplot 2
ax[1].plot([1, 2, 3, 4], [1, 3, 6, 10], lw=2.0)
plt.show()
Output:
Customizing Line Width in Matplotlib
In addition to the basic line width settings, you can further customize the line width in matplotlib using various parameters. Some of these parameters include:
antialiased: A boolean value to enable or disable antialiasing for the linesolid_capstyle: The cap style for the line’s endpoint
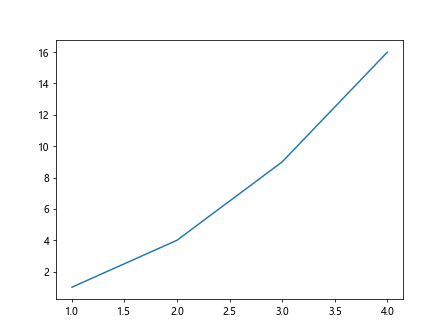
Let’s see an example of customizing line width in matplotlib:
import matplotlib.pyplot as plt

# Example 12: Customizing line width settings
plt.plot([1, 2, 3, 4], [1, 4, 9, 16], lw=1.5, solid_capstyle='round', antialiased=True)
plt.show()
Output:
Using Line Collection for Custom Line Styles
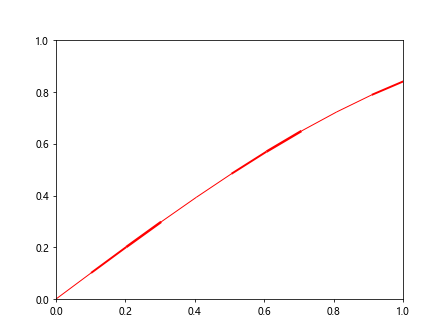
In matplotlib, you can create custom line styles using the LineCollection class. This allows you to define a collection of line segments with different properties, including line width. Let’s see an example of using LineCollection for custom line styles:
import matplotlib.pyplot as plt
from matplotlib.collections import LineCollection
import numpy as np

# Example 13: Using LineCollection for custom line styles
x = np.linspace(0, 10, 100)
y = np.sin(x)

lines = [[(x[i], y[i]), (x[i+1], y[i+1])] for i in range(len(x)-1)]
lc = LineCollection(lines, linewidths=[1, 2, 2.5, 1], colors='red')
plt.gca().add_collection(lc)
plt.show()
Output:
Line Width in 3D Plots
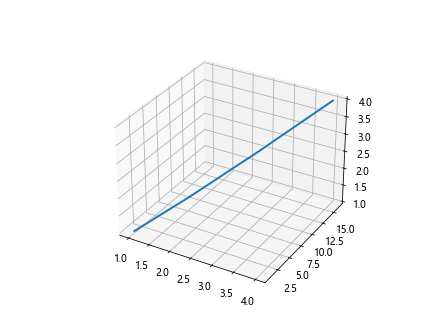
Matplotlib also supports 3D plots, where you can adjust the line width in the 3D space. Let’s see an example of setting line width in a 3D plot:
import matplotlib.pyplot as plt
from mpl_toolkits.mplot3d import Axes3D

# Example 14: Setting line width in 3D plot
fig = plt.figure()
ax = fig.add_subplot(111, projection='3d')
ax.plot([1, 2, 3, 4], [1, 4, 9, 16], [1, 2, 3, 4], linewidth=2.0)
plt.show()
Output:
Line Width in Polar Plots
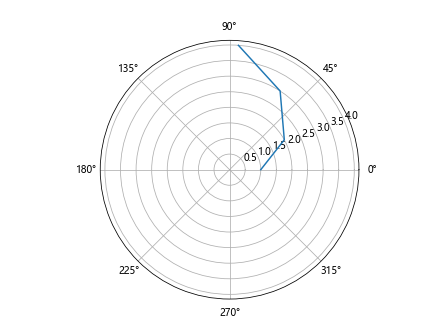
In matplotlib, polar plots are often used to represent data in polar coordinates. You can also adjust the line width in polar plots. Let’s see an example of setting line width in a polar plot:
import matplotlib.pyplot as plt

# Example 15: Setting line width in polar plot
plt.figure()
ax = plt.subplot(111, polar=True)
ax.plot([0, 0.5, 1, 1.5], [1, 2, 3, 4], linewidth=1.5)
plt.show()
Output:
Line Width in Contour Plots
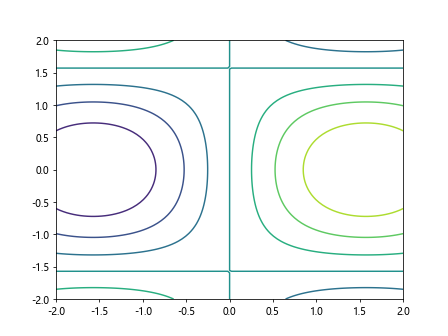
Contour plots are used to represent 3D data on a 2D surface with contour lines. You can adjust the line width of the contour lines in matplotlib. Let’s see an example of setting line width in a contour plot:
import matplotlib.pyplot as plt
import numpy as np

# Example 16: Setting line width in contour plot
x = np.linspace(-2, 2, 100)
y = np.linspace(-2, 2, 100)
X, Y = np.meshgrid(x, y)
Z = np.sin(X) * np.cos(Y)

plt.contour(X, Y, Z, linewidths=1.5)
plt.show()
Output:
Line Width in Quiver Plots
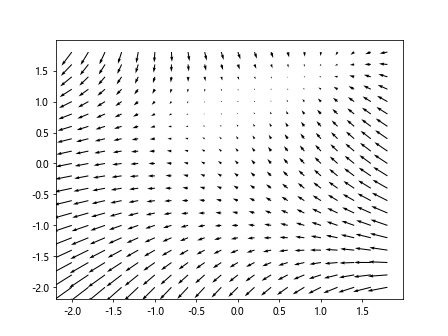
Quiver plots are used to represent vector fields with arrows. You can adjust the line width of the arrows in quiver plots in matplotlib. Let’s see an example of setting line width in a quiver plot:
import matplotlib.pyplot as plt
import numpy as np

# Example 17: Setting line width in quiver plot
x = np.arange(-2, 2, 0.2)
y = np.arange(-2, 2, 0.2)
X, Y = np.meshgrid(x, y)
U = -1 - X**2 + Y
V = 1 + X - Y**2

plt.quiver(X, Y, U, V, linewidth=2.0)
plt.show()
Output:
Conclusion
In this article, we have explored how to adjust the line width when creating plots using matplotlib. We have seen examples of setting line width, line width styles, line colors, line widths for multiple lines, using line width in different plot types, line width in subplots, customizing line width, using LineCollection for custom line styles, line width in 3D plots, polar plots, contour plots, and quiver plots. By understanding how to control line width in matplotlib, you can create visually appealing and informative plots for your data visualization needs.
Remember, the line width parameter in matplotlib allows you to fine-tune the appearance of your plots and convey your data effectively. Experiment with different line widths and styles to find the best representation for your data visualization tasks.