3D Scatterplots in Python Matplotlib with Hue Colormap and Legend
Creating 3D scatterplots in Python using Matplotlib is a powerful way to visualize three-dimensional data. By incorporating different hues and a legend, these plots can convey additional layers of information. This article will guide you through the process of creating 3D scatterplots, enhancing them with a hue-based colormap, and adding a legend to effectively communicate the data’s structure and insights.
Introduction to 3D Scatterplots
A 3D scatterplot is a type of plot that displays points in three dimensions, allowing the viewer to observe the relationships and patterns among three different datasets. In Python, Matplotlib’s mpl_toolkits.mplot3d module is used to create these plots. The addition of a hue colormap can represent another dimension of data, such as categories or a continuous variable, by coloring the points accordingly.
Setting Up Your Environment
Before diving into the examples, ensure you have the necessary tools installed. You will need Python and Matplotlib. You can install Matplotlib using pip:
pip install matplotlib
Basic 3D Scatterplot
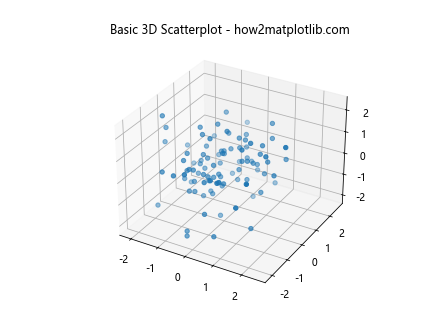
Let’s start with a basic 3D scatterplot. The following example sets up a 3D scatterplot environment and adds a simple set of data points.
import matplotlib.pyplot as plt
from mpl_toolkits.mplot3d import Axes3D
import numpy as np

fig = plt.figure()
ax = fig.add_subplot(111, projection='3d')

x = np.random.standard_normal(100)
y = np.random.standard_normal(100)
z = np.random.standard_normal(100)

ax.scatter(x, y, z)
ax.set_title("Basic 3D Scatterplot - how2matplotlib.com")
plt.show()
Output:
Adding Color Using Hue
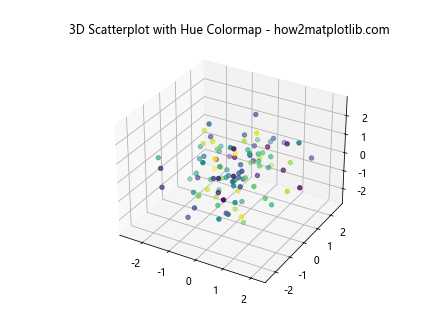
To add a hue colormap to the scatterplot, you can use the c parameter in the scatter function. This parameter accepts an array of colors or numbers and applies a colormap to the points.
import matplotlib.pyplot as plt
from mpl_toolkits.mplot3d import Axes3D
import numpy as np

fig = plt.figure()
ax = fig.add_subplot(111, projection='3d')

x = np.random.standard_normal(100)
y = np.random.standard_normal(100)
z = np.random.standard_normal(100)

colors = np.random.rand(100)
ax.scatter(x, y, z, c=colors, cmap='viridis')
ax.set_title("3D Scatterplot with Hue Colormap - how2matplotlib.com")
plt.show()
Output:
Customizing the Colormap
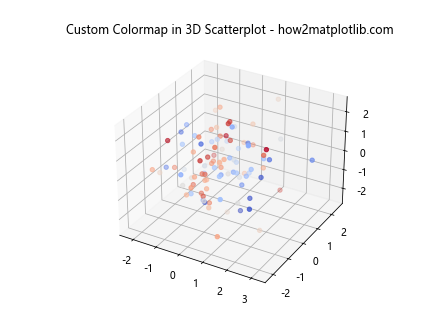
You can customize the colormap to better suit your data or preferences. Matplotlib offers a variety of built-in colormaps.
import matplotlib.pyplot as plt
from mpl_toolkits.mplot3d import Axes3D
import numpy as np

fig = plt.figure()
ax = fig.add_subplot(111, projection='3d')

x = np.random.standard_normal(100)
y = np.random.standard_normal(100)
z = np.random.standard_normal(100)
colors = np.random.rand(100)

ax.scatter(x, y, z, c=colors, cmap='coolwarm')
ax.set_title("Custom Colormap in 3D Scatterplot - how2matplotlib.com")
plt.show()
Output:
Adding a Legend
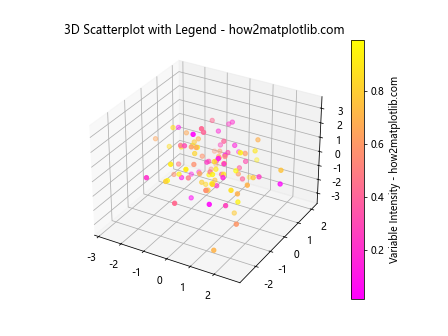
To add a legend that reflects the color scale, use the Colorbar function from Matplotlib.
import matplotlib.pyplot as plt
from mpl_toolkits.mplot3d import Axes3D
import numpy as np

fig = plt.figure()
ax = fig.add_subplot(111, projection='3d')

x = np.random.standard_normal(100)
y = np.random.standard_normal(100)
z = np.random.standard_normal(100)
colors = np.random.rand(100)

sc = ax.scatter(x, y, z, c=colors, cmap='spring')
cbar = plt.colorbar(sc)
cbar.set_label('Variable Intensity - how2matplotlib.com')
ax.set_title("3D Scatterplot with Legend - how2matplotlib.com")
plt.show()
Output:
Example with Real-World Data
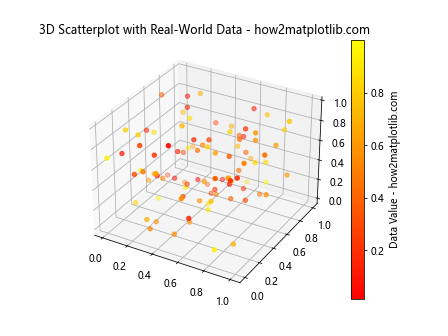
Let’s apply these concepts to a real-world dataset. We’ll use randomly generated data to simulate real-world conditions.
import matplotlib.pyplot as plt
from mpl_toolkits.mplot3d import Axes3D
import numpy as np

fig = plt.figure()
ax = fig.add_subplot(111, projection='3d')

x = np.random.standard_normal(100)
y = np.random.standard_normal(100)
z = np.random.standard_normal(100)
colors = np.random.rand(100)

data = np.random.rand(100, 4)
x, y, z, values = data[:,0], data[:,1], data[:,2], data[:,3]

fig = plt.figure()
ax = fig.add_subplot(111, projection='3d')
sc = ax.scatter(x, y, z, c=values, cmap='autumn')
cbar = plt.colorbar(sc)
cbar.set_label('Data Value - how2matplotlib.com')
ax.set_title("3D Scatterplot with Real-World Data - how2matplotlib.com")
plt.show()
Output:
Interactive 3D Scatterplots
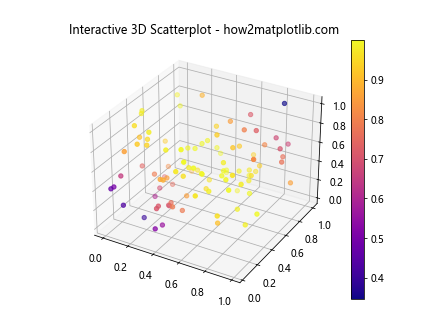
For a more interactive experience, you can integrate Matplotlib’s plots with widgets or other interactive tools. Here’s a basic setup using mpl_toolkits.mplot3d.
from mpl_toolkits.mplot3d import Axes3D
import matplotlib.pyplot as plt
import numpy as np

fig = plt.figure()
ax = fig.add_subplot(111, projection='3d')

x = np.random.standard_normal(100)
y = np.random.standard_normal(100)
z = np.random.standard_normal(100)
colors = np.random.rand(100)

fig = plt.figure()
ax = fig.add_subplot(111, projection='3d')
x, y, z = np.random.rand(3, 100)
sc = ax.scatter(x, y, z, c=np.sin(x + y + z), cmap='plasma')
plt.colorbar(sc)
ax.set_title("Interactive 3D Scatterplot - how2matplotlib.com")
plt.show()
Output:
Conclusion
3D scatterplots are a versatile tool for visualizing complex datasets in three dimensions. By using different hues and adding a legend, you can convey additional information about the data. The examples provided in this article demonstrate how to implement these techniques using Matplotlib in Python. Whether you are analyzing simple datasets or complex real-world data, these techniques can enhance your data visualization capabilities.
Remember, the key to effective data visualization is not only in choosing the right type of plot but also in how well you can customize and present the data to your audience. With the tools and examples provided here, you should be well-equipped to create informative and visually appealing 3D scatterplots.