Matplotlib: Plot Point with Label
Matplotlib is a powerful Python library for creating static, animated, and interactive visualizations in Python. In this article, we will explore how to plot points with labels using Matplotlib.
Basic Scatter Plot with Labels
import matplotlib.pyplot as plt

x = [1, 2, 3, 4, 5]
y = [2, 3, 4, 5, 6]
labels = ['A', 'B', 'C', 'D', 'E']

plt.scatter(x, y)

for i, label in enumerate(labels):
    plt.text(x[i], y[i], label)

plt.show()
Output:
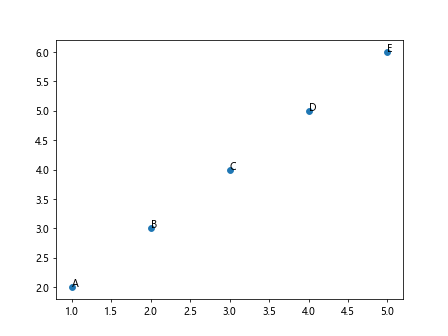
In the example above, we have created a simple scatter plot with labels for each point. The plt.scatter() function is used to create the scatter plot, and plt.text() is used to add labels to each point.
Customizing Label Position and Color
import matplotlib.pyplot as plt

x = [1, 2, 3, 4, 5]
y = [2, 3, 4, 5, 6]
labels = ['A', 'B', 'C', 'D', 'E']

plt.scatter(x, y)

for i, label in enumerate(labels):
    plt.text(x[i]+0.1, y[i]+0.1, label, color='red')

plt.show()
Output:
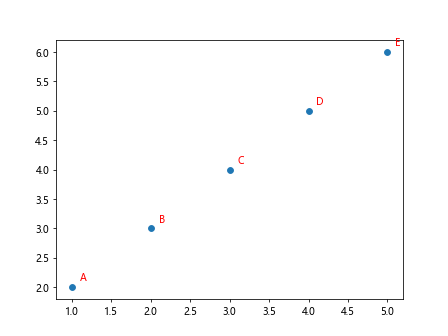
In this example, we have customized the position of the labels by adding an offset of 0.1 to both x and y coordinates. We have also changed the color of the labels to red.
Changing Font Size and Style
import matplotlib.pyplot as plt

x = [1, 2, 3, 4, 5]
y = [2, 3, 4, 5, 6]
labels = ['A', 'B', 'C', 'D', 'E']

plt.scatter(x, y)

for i, label in enumerate(labels):
    plt.text(x[i], y[i], label, fontsize=12, fontstyle='italic')

plt.show()
Output:
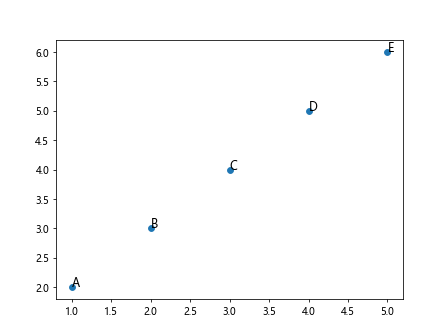
In this example, we have changed the font size of the labels to 12 and set the font style to italic. You can customize the font size, font style, and font weight to meet your requirements.
Adding Background Color to Labels
import matplotlib.pyplot as plt

x = [1, 2, 3, 4, 5]
y = [2, 3, 4, 5, 6]
labels = ['A', 'B', 'C', 'D', 'E']

plt.scatter(x, y)

for i, label in enumerate(labels):
    plt.text(x[i], y[i], label, backgroundcolor='yellow')

plt.show()
Output:
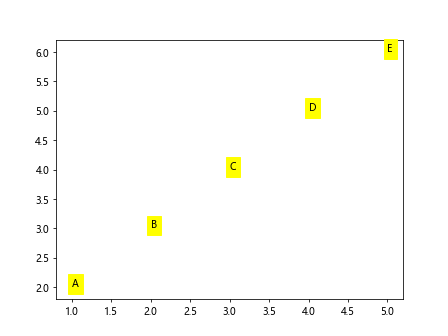
In this example, we have added a yellow background color to the labels. You can customize the background color to make the labels more visible against the plot.
Rotating Labels
import matplotlib.pyplot as plt

x = [1, 2, 3, 4, 5]
y = [2, 3, 4, 5, 6]
labels = ['A', 'B', 'C', 'D', 'E']

plt.scatter(x, y)

for i, label in enumerate(labels):
    plt.text(x[i], y[i], label, rotation=45)

plt.show()
Output:
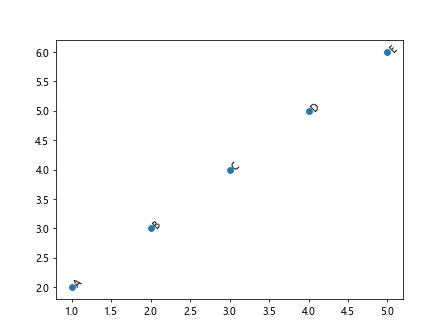
In this example, we have rotated the labels by 45 degrees. You can adjust the rotation angle to suit your visualization needs.
Using Different Alignment for Labels
import matplotlib.pyplot as plt

x = [1, 2, 3, 4, 5]
y = [2, 3, 4, 5, 6]
labels = ['A', 'B', 'C', 'D', 'E']

plt.scatter(x, y)

for i, label in enumerate(labels):
    plt.text(x[i], y[i], label, ha='right', va='bottom')

plt.show()
Output:
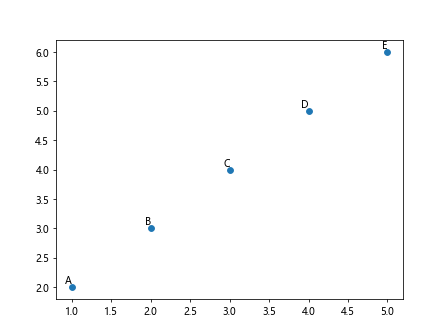
In this example, we have aligned the labels to the right and bottom of each point. You can adjust the horizontal alignment (ha) and vertical alignment (va) to position the labels as desired.
Adding Annotations to Points
import matplotlib.pyplot as plt

x = [1, 2, 3, 4, 5]
y = [2, 3, 4, 5, 6]
labels = ['A', 'B', 'C', 'D', 'E']

plt.scatter(x, y)

for i, label in enumerate(labels):
    plt.annotate(label, (x[i], y[i]), xytext=(x[i]+0.5, y[i]+0.5), arrowprops=dict(facecolor='black'))

plt.show()
Output:
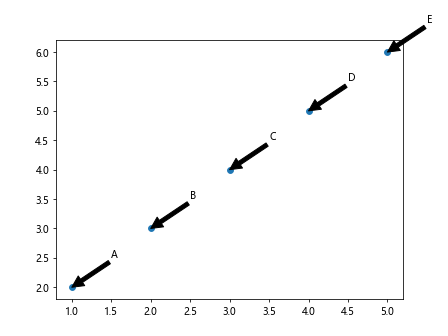
In this example, we have added annotations to each point using the plt.annotate() function. The annotations include labels and arrows pointing to the respective points.
Changing Font Family
import matplotlib.pyplot as plt

x = [1, 2, 3, 4, 5]
y = [2, 3, 4, 5, 6]
labels = ['A', 'B', 'C', 'D', 'E']

plt.scatter(x, y)

for i, label in enumerate(labels):
    plt.text(x[i], y[i], label, fontname='Comic Sans MS')

plt.show()
Output:
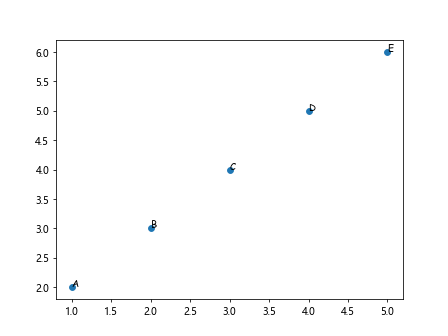
In this example, we have changed the font family of the labels to ‘Comic Sans MS’. You can use any font installed on your system to customize the appearance of the labels.
Adjusting Label Padding
import matplotlib.pyplot as plt

x = [1, 2, 3, 4, 5]
y = [2, 3, 4, 5, 6]
labels = ['A', 'B', 'C', 'D', 'E']

plt.scatter(x, y)

for i, label in enumerate(labels):
    plt.text(x[i], y[i], label, bbox=dict(facecolor='red', alpha=0.5, pad=5))

plt.show()
Output:
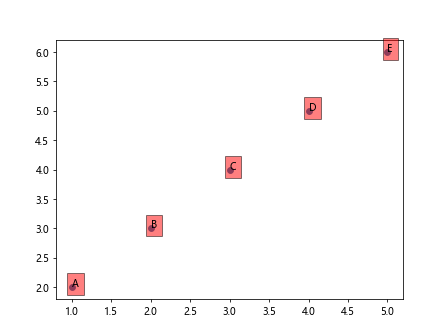
In this example, we have adjusted the padding around the labels by setting the pad parameter to 5. You can customize the padding to ensure that the labels do not overlap with the data points.
Using LaTeX in Labels
import matplotlib.pyplot as plt

x = [1, 2, 3, 4, 5]
y = [2, 3, 4, 5, 6]
labels = [r'$\alpha$', r'$\beta$', r'$\gamma$', r'$\delta$', r'$\epsilon$']

plt.scatter(x, y)

for i, label in enumerate(labels):
    plt.text(x[i], y[i], label)

plt.show()
Output:
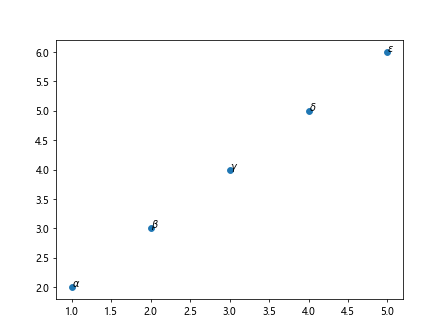
In this example, we have used LaTeX notation to include mathematical symbols in the labels. You can use LaTeX syntax to customize the appearance of the labels with mathematical expressions.
Using Different Marker Styles
import matplotlib.pyplot as plt

x = [1, 2, 3, 4, 5]
y = [2, 3, 4, 5, 6]
labels = ['A', 'B', 'C', 'D', 'E']

plt.scatter(x, y, marker='^')

for i, label in enumerate(labels):
    plt.text(x[i], y[i], label)

plt.show()
Output:
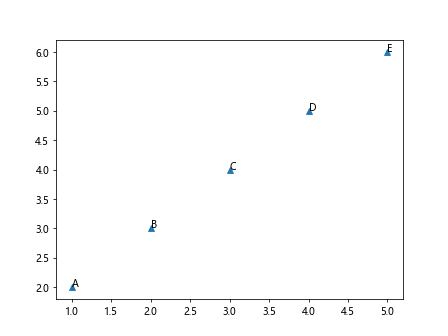
In this example, we have changed the marker style of the data points to a triangle (‘^’). You can use different marker styles to customize the appearance of the data points in the plot.
Plotting Points with Labels in Subplots
import matplotlib.pyplot as plt

x1 = [1, 2, 3, 4, 5]
y1 = [2, 3, 4, 5, 6]
labels1 = ['A', 'B', 'C', 'D', 'E']

x2 = [2, 3, 4, 5, 6]
y2 = [3, 4, 5, 6, 7]
labels2 = ['F', 'G', 'H', 'I', 'J']

plt.figure(figsize=(10, 5))

plt.subplot(1, 2, 1)
plt.scatter(x1, y1)
for i, label in enumerate(labels1):
    plt.text(x1[i], y1[i], label)

plt.subplot(1, 2, 2)
plt.scatter(x2, y2)
for i, label in enumerate(labels2):
    plt.text(x2[i], y2[i], label)

plt.show()
Output:
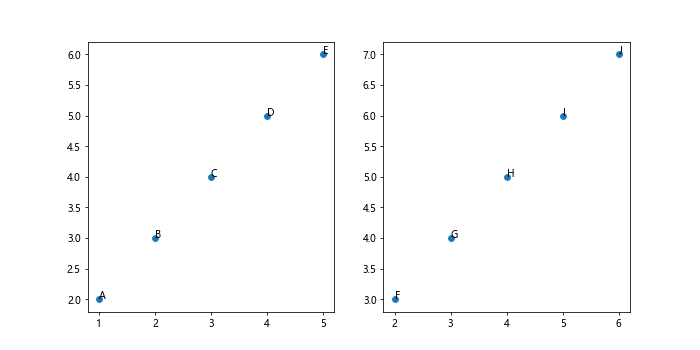
In this example, we have plotted points with labels in two subplots. We use the plt.subplot() function to create two subplots side by side and plot points with labels in each subplot.
Adding Annotations with Arrow Properties
import matplotlib.pyplot as plt

x = [1, 2, 3, 4, 5]
y = [2, 3, 4, 5, 6]
labels = ['A', 'B', 'C', 'D', 'E']

plt.scatter(x, y)

for i, label in enumerate(labels):
    plt.annotate(label, (x[i], y[i]), xytext=(x[i]+0.5, y[i]+0.5), arrowprops=dict(arrowstyle='->'))

plt.show()
Output:
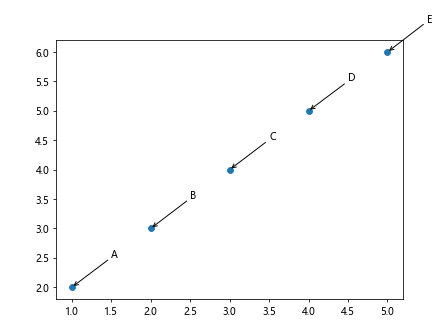
In this example, we have added annotations with arrow properties to each point. The arrowprops parameter allows you to customize the appearance of the arrow pointing to the labels.
Plotting Points with Colored Labels
import matplotlib.pyplot as plt

x = [1, 2, 3, 4, 5]
y = [2, 3, 4, 5, 6]
labels = ['A', 'B', 'C', 'D', 'E']
colors = ['red', 'blue', 'green', 'purple', 'orange']

plt.scatter(x, y)

for i, (label, color) in enumerate(zip(labels, colors)):
    plt.text(x[i], y[i], label, color=color)

plt.show()
Output:
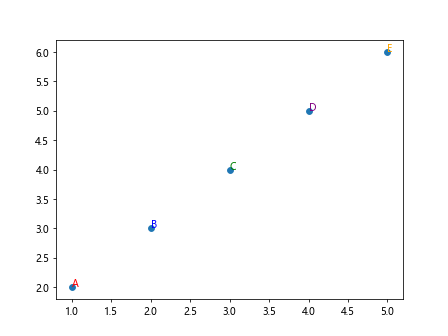
In this example, we have plotted points with colored labels. We use the zip() function to iterate over both the labels and colors lists simultaneously and assign the corresponding color to each label.
Plotting Points with Shadowed Labels
import matplotlib.pyplot as plt

x = [1, 2, 3, 4, 5]
y = [2, 3, 4, 5, 6]
labels = ['A', 'B', 'C', 'D', 'E']

plt.scatter(x, y)

for i, label in enumerate(labels):
    plt.text(x[i], y[i], label, fontsize=12, fontstyle='italic', color='white', path_effects=[PathEffects.withStroke(linewidth=3, foreground='black')])

plt.show()
In this example, we have plotted points with shadowed labels. We apply a shadow effect to the labels using the path_effects parameter to make them stand out against the background.
Conclusion
In this article, we have explored how to plot points with labels using Matplotlib. We have covered various customization options, such as changing label positions, colors, font styles, and alignment, as well as adding annotations and using LaTeX notation in labels. By mastering these techniques, you can create visually appealing plots with informative labels in your data visualizations using Matplotlib.