Matplotlib Plot Markersize
Matplotlib is a widely used plotting library in Python that provides a variety of options for customizing plots. One common customization is adjusting the size of markers used in plots. In this article, we will explore how to adjust the markersize in Matplotlib plots.
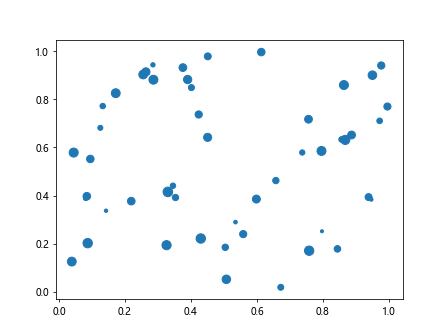
Set Markersize in Scatter Plot
In a scatter plot, markersize controls the size of markers used to represent data points. The markersize can be set using the s parameter in the scatter function. Here is an example of how to set markersize in a scatter plot:
import matplotlib.pyplot as plt
import numpy as np

x = np.random.rand(50)
y = np.random.rand(50)
sizes = np.random.randint(10, 100, 50)

plt.scatter(x, y, s=sizes)
plt.show()
Output:
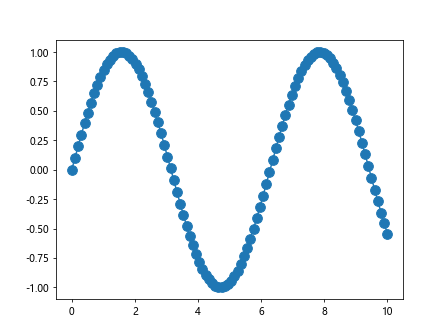
Adjust Markersize with Line Plot
In a line plot, markersize controls the size of markers used to mark data points along the line. The markersize can be set using the markersize parameter in the plot function. Here is an example of how to adjust markersize in a line plot:
import matplotlib.pyplot as plt
import numpy as np

x = np.linspace(0, 10, 100)
y = np.sin(x)

plt.plot(x, y, marker='o', markersize=10)
plt.show()
Output:
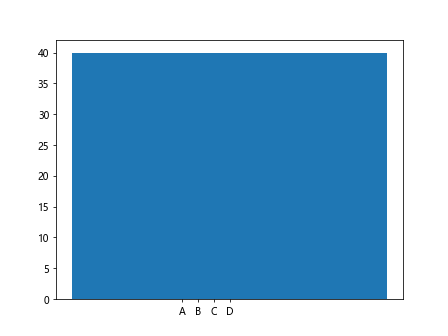
Specify Markersize in Bar Plot
In a bar plot, markersize controls the size of markers used to represent data bars. The markersize can be set using the width parameter in the bar function. Here is an example of how to specify markersize in a bar plot:
import matplotlib.pyplot as plt
import numpy as np

x = ['A', 'B', 'C', 'D']
y = [10, 20, 30, 40]
sizes = [5, 10, 15, 20]

plt.bar(x, y, width=sizes)
plt.show()
Output:
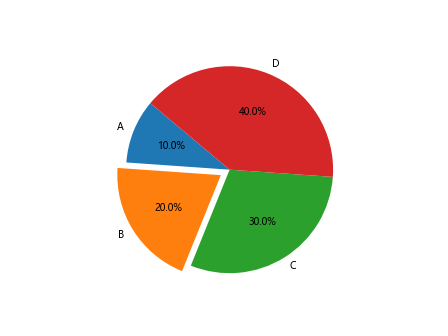
Customize Markersize in Pie Chart
In a pie chart, markersize controls the relative size of each pie slice. The markersize can be set using the sizes parameter in the pie function. Here is an example of how to customize markersize in a pie chart:
import matplotlib.pyplot as plt
import numpy as np

labels = ['A', 'B', 'C', 'D']
sizes = [15, 30, 45, 60]
explode = (0, 0.1, 0, 0)

plt.pie(sizes, labels=labels, explode=explode, autopct='%1.1f%%', startangle=140)
plt.show()
Output:
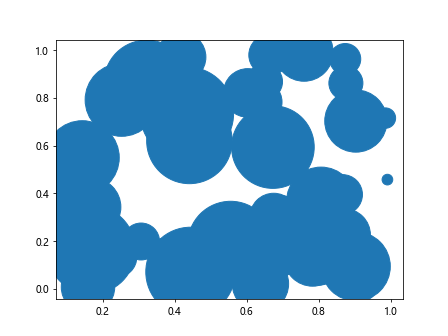
Adjust Markersize in Bubble Plot
In a bubble plot, markersize controls the size of bubbles representing data points. The markersize can be set using the s parameter in the scatter function. Here is an example of how to adjust markersize in a bubble plot:
import matplotlib.pyplot as plt
import numpy as np

x = np.random.rand(50)
y = np.random.rand(50)
sizes = np.random.randint(10, 100, 50)

plt.scatter(x, y, s=sizes**2)
plt.show()
Output:
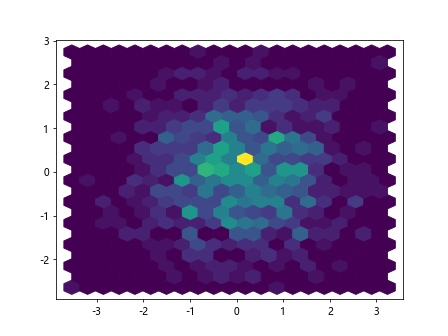
Customize Markersize with Hexbin Plot
In a hexbin plot, markersize controls the size of hexagons representing data points. The markersize can be set using the gridsize parameter in the hexbin function. Here is an example of how to customize markersize in a hexbin plot:
import matplotlib.pyplot as plt
import numpy as np

x = np.random.randn(1000)
y = np.random.randn(1000)

plt.hexbin(x, y, gridsize=20)
plt.show()
Output:
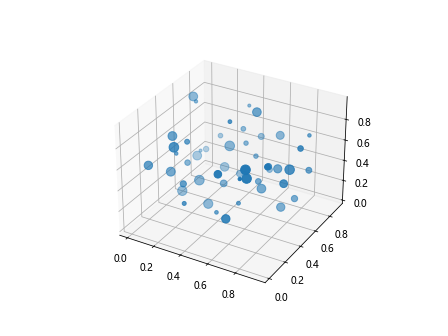
Set Markersize in 3D Scatter Plot
In a 3D scatter plot, markersize controls the size of markers in three dimensions. The markersize can be set using the s parameter in the scatter function. Here is an example of how to set markersize in a 3D scatter plot:
import matplotlib.pyplot as plt
import numpy as np

fig = plt.figure()
ax = fig.add_subplot(111, projection='3d')

x = np.random.rand(50)
y = np.random.rand(50)
z = np.random.rand(50)
sizes = np.random.randint(10, 100, 50)

ax.scatter(x, y, z, s=sizes)
plt.show()
Output:
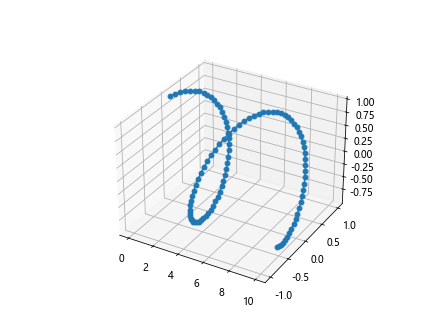
Adjust Markersize with 3D Line Plot
In a 3D line plot, markersize controls the size of markers in three dimensions. The markersize can be set using the markersize parameter in the plot function. Here is an example of how to adjust markersize in a 3D line plot:
import matplotlib.pyplot as plt
import numpy as np

fig = plt.figure()
ax = fig.add_subplot(111, projection='3d')

x = np.linspace(0, 10, 100)
y = np.sin(x)
z = np.cos(x)

ax.plot(x, y, z, marker='o', markersize=5)
plt.show()
Output:
Specify Markersize in 3D Bar Plot
In a 3D bar plot, markersize controls the size of markers in three dimensions. The markersize can be set using the width parameter in the bar3d function. Here is an example of how to specify markersize in a 3D bar plot:
import matplotlib.pyplot as plt
import numpy as np

fig = plt.figure()
ax = fig.add_subplot(111, projection='3d')

x = np.array([1, 2, 3, 4])
y = np.array([1, 2, 3, 4])
z = np.zeros(4)
dx = dy = dz = np.ones(4)
sizes = [0.1, 0.2, 0.3, 0.4]

ax.bar3d(x, y, z, dx, dy, dz, width=sizes)
plt.show()
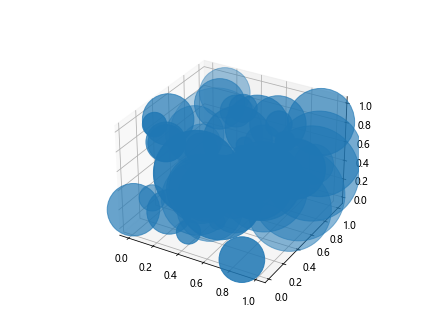
Customize Markersize in 3D Bubble Plot
In a 3D bubble plot, markersize controls the size of bubbles in three dimensions. The markersize can be set using the s parameter in the scatter function. Here is an example of how to customize markersize in a 3D bubble plot:
import matplotlib.pyplot as plt
import numpy as np

fig = plt.figure()
ax = fig.add_subplot(111, projection='3d')

x = np.random.rand(50)
y = np.random.rand(50)
z = np.random.rand(50)
sizes = np.random.randint(10, 100, 50)

ax.scatter(x, y, z, s=sizes**2)
plt.show()
Output:
Conclusion
In this article, we have explored different ways to adjust and customize markersize in Matplotlib plots. By using the examples provided, you can easily control the size of markers in various types of plots, from simple scatter plots to complex 3D plots. Experiment with different markersize values to find the perfect fit for your visualization needs.