Matplotlib Plot Marker Size
Matplotlib is a popular data visualization library in Python that allows you to create high-quality plots and charts. When plotting data points, you can customize the size of the markers to highlight or differentiate certain points in your plot.
Setting Marker Size in Matplotlib
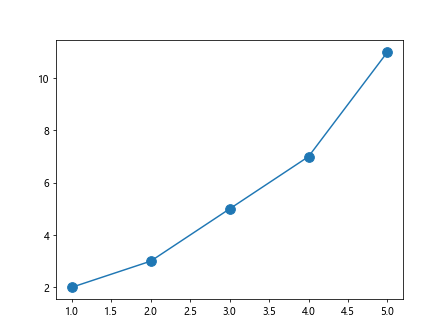
You can set the marker size in Matplotlib by using the markersize attribute in the plot function. The markersize attribute allows you to specify the size of the markers in points.
import matplotlib.pyplot as plt

# Create some data
x = [1, 2, 3, 4, 5]
y = [2, 3, 5, 7, 11]

# Plot the data with marker size 10
plt.plot(x, y, marker='o', markersize=10)
plt.show()
Output:
Customizing Marker Size
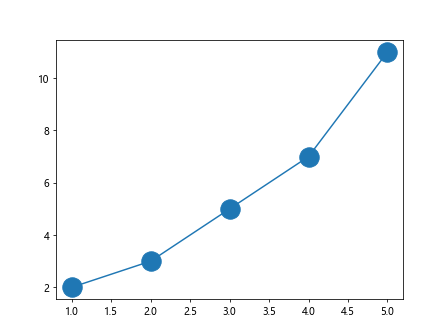
You can customize the marker size further by adjusting the markersize attribute to your desired value.
import matplotlib.pyplot as plt

# Create some data
x = [1, 2, 3, 4, 5]
y = [2, 3, 5, 7, 11]

# Plot the data with marker size 20
plt.plot(x, y, marker='o', markersize=20)
plt.show()
Output:
Using different marker styles
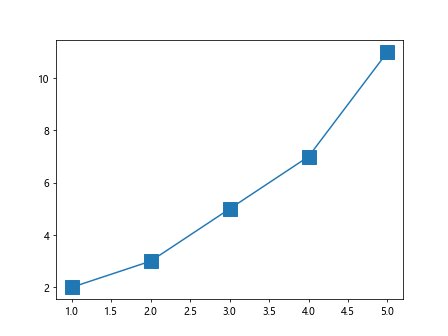
In addition to customizing the marker size, you can also use different marker styles to represent data points.
import matplotlib.pyplot as plt

# Create some data
x = [1, 2, 3, 4, 5]
y = [2, 3, 5, 7, 11]

# Plot the data with marker style 'squared' and size 15
plt.plot(x, y, marker='s', markersize=15)
plt.show()
Output:
Creating Scatter Plots with Marker Size
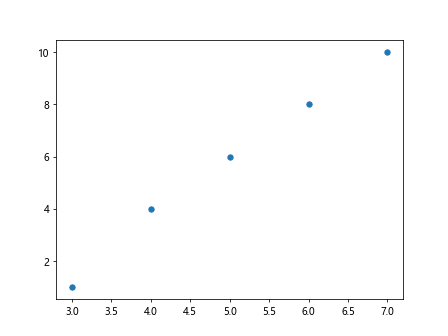
Scatter plots are commonly used to visualize the relationship between two variables. You can customize the marker size in scatter plots as well.
import matplotlib.pyplot as plt

# Create some data
x = [1, 2, 3, 4, 5]
y = [2, 3, 5, 7, 11]

# Create some more data
x2 = [3, 4, 5, 6, 7]
y2 = [1, 4, 6, 8, 10]

# Create a scatter plot with marker size 30
plt.scatter(x2, y2, s=30)
plt.show()
Output:
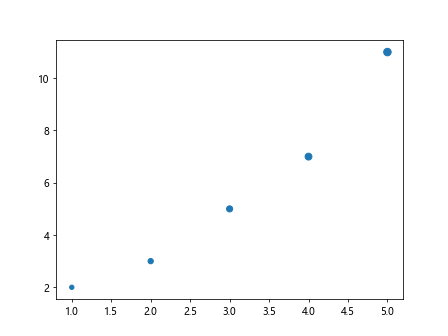
Adjusting Marker Size based on Data
Sometimes you may want to adjust the marker size based on the data you are plotting. This can be done by passing an array of sizes to the s parameter in the scatter function.
import matplotlib.pyplot as plt

# Create some data
x = [1, 2, 3, 4, 5]
y = [2, 3, 5, 7, 11]

# Create an array of marker sizes based on data values
sizes = [20, 30, 40, 50, 60]

# Create a scatter plot with variable marker sizes
plt.scatter(x, y, s=sizes)
plt.show()
Output:
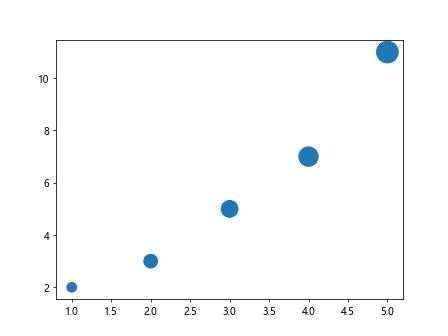
Creating Bubble Plots
Bubble plots are a type of scatter plot where the size of the marker represents a third dimension of the data. You can create bubble plots by customizing the marker size based on an additional data array.
import matplotlib.pyplot as plt

# Create some data
x = [1, 2, 3, 4, 5]
y = [2, 3, 5, 7, 11]

# Create another data array
z = [100, 200, 300, 400, 500]

# Create a bubble plot with marker size based on data 'z'
plt.scatter(x, y, s=z)
plt.show()
Output:
Customizing Marker Size and Color
You can further enhance your plots by customizing both the marker size and color. This can be done by using the c parameter to specify colors and cmap to apply a colormap to the marker colors.
import matplotlib.pyplot as plt

# Create some data
x = [1, 2, 3, 4, 5]
y = [2, 3, 5, 7, 11]

# Create a bubble plot with marker size and color customization
plt.scatter(x2, y2, s=z, c=z, cmap='viridis')
plt.show()
Adding Labels and Legends
To better understand your plots, you can add labels and legends to provide more information about the data being displayed. Labels can be added using the xlabel and ylabel functions, while legends can be added using the legend function.
import matplotlib.pyplot as plt

# Create some data
x = [1, 2, 3, 4, 5]
y = [2, 3, 5, 7, 11]

plt.scatter(x, y, s=z, c=z, cmap='viridis', label='Bubble Plot')
plt.xlabel('X-axis')
plt.ylabel('Y-axis')
plt.legend()
plt.show()
Conclusion
In conclusion, setting marker size in Matplotlib allows you to customize your plots and create visually appealing visualizations. By adjusting the size of the markers, you can highlight specific data points and convey information more effectively. Experiment with different marker sizes and styles to create unique and informative plots.
Remember to refer to the Matplotlib documentation for more customization options and advanced techniques.