Matplotlib Plot Error Bar
Matplotlib is a popular Python library used for creating static, interactive, and animated visualizations in Python. One of the common tasks in data visualization is to plot error bars along with the data points to show the uncertainty or variability in the data. In this article, we will explore how to plot error bars in Matplotlib.
Basic Error Bar Plot
The simplest way to plot error bars in Matplotlib is by using the errorbar function. Let’s create a basic error bar plot with random data.
import matplotlib.pyplot as plt
import numpy as np

x = np.arange(10)
y = np.random.rand(10)
errors = np.random.rand(10)

plt.errorbar(x, y, yerr=errors, fmt='o', color='b')
plt.show()
Output:
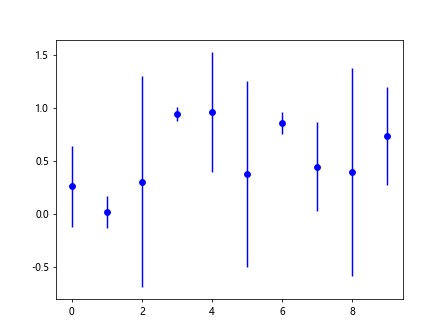
In this example, we are creating an error bar plot with random data points. The yerr parameter is used to specify the error bars. The fmt parameter is used to specify the marker style and color.
Custom Error Bar Plot
You can customize the error bars in Matplotlib by specifying various parameters such as line width, capsize, and error bar color. Let’s create a custom error bar plot.
import matplotlib.pyplot as plt
import numpy as np

x = np.arange(10)
y = np.random.rand(10)
errors = np.random.rand(10)

plt.errorbar(x, y, yerr=errors, fmt='o', color='r', ecolor='g', elinewidth=2, capsize=5)
plt.show()
Output:
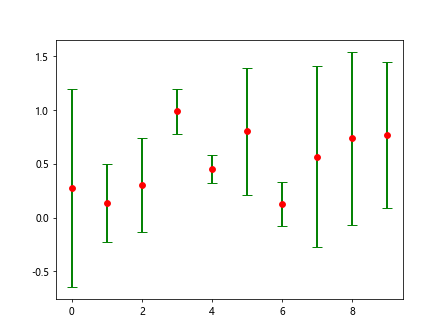
In this example, we are customizing the error bars by changing the error bar color to green, increasing the error bar line width, and setting the cap size of the error bars.
Grouped Error Bar Plot
You can create grouped error bar plots in Matplotlib to compare multiple sets of data with error bars. Let’s create a grouped error bar plot.
import matplotlib.pyplot as plt
import numpy as np

x = np.arange(3)
y1 = np.random.rand(3)
y2 = np.random.rand(3)
errors1 = np.random.rand(3)
errors2 = np.random.rand(3)

plt.errorbar(x, y1, yerr=errors1, fmt='o', color='b', label='Group 1')
plt.errorbar(x, y2, yerr=errors2, fmt='o', color='r', label='Group 2')
plt.legend()
plt.show()
Output:
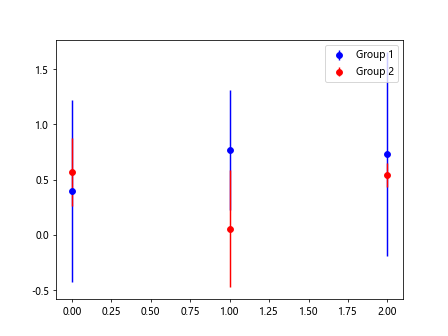
In this example, we are creating a grouped error bar plot with two sets of data. The label parameter is used to specify the legend for each group.
Horizontal Error Bar Plot
You can also create horizontal error bar plots in Matplotlib by using the xerr parameter. Let’s create a horizontal error bar plot.
import matplotlib.pyplot as plt
import numpy as np

x = np.arange(10)
y = np.random.rand(10)
errors = np.random.rand(10)

plt.errorbar(y, x, xerr=errors, fmt='o', color='b')
plt.show()
Output:
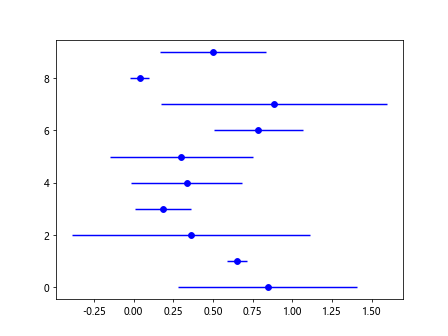
In this example, we are creating a horizontal error bar plot with random data. The xerr parameter is used to specify the error bars in the x-direction.
Error Bar Plot with Log Scale
You can plot error bars in Matplotlib with a logarithmic scale. Let’s create an error bar plot with a log scale.
import matplotlib.pyplot as plt
import numpy as np

x = np.arange(10)
y = np.random.rand(10)
errors = np.random.rand(10)

plt.errorbar(x, y, yerr=errors, fmt='o', color='b')
plt.yscale('log')
plt.show()
Output:
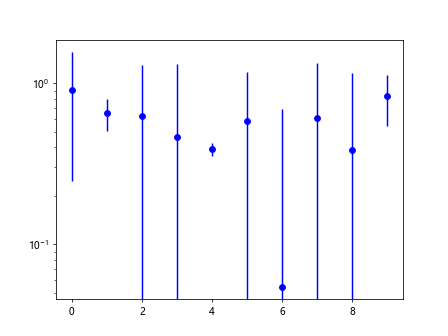
In this example, we are creating an error bar plot with random data and setting the y-axis to a log scale using the yscale function.
Error Bar Plot with Different Cap Styles
You can customize the cap style of the error bars in Matplotlib by using the capstyle parameter. Let’s create an error bar plot with different cap styles.
import matplotlib.pyplot as plt
import numpy as np

x = np.arange(10)
y = np.random.rand(10)
errors = np.random.rand(10)

plt.errorbar(x, y, yerr=errors, fmt='o', color='b', capsize=5, capthick=2, capstyle='projecting')
plt.show()
In this example, we are customizing the cap style of the error bars to be projecting. You can also use other cap styles such as butt or round.
Error Bar Plot with Marker Customization
You can customize the markers in an error bar plot in Matplotlib by using the marker parameter. Let’s create an error bar plot with customized markers.
import matplotlib.pyplot as plt
import numpy as np

x = np.arange(10)
y = np.random.rand(10)
errors = np.random.rand(10)

plt.errorbar(x, y, yerr=errors, fmt='s', color='b')
plt.show()
Output:
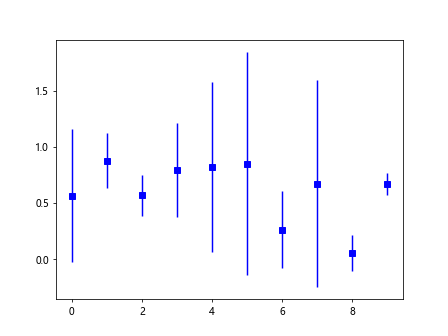
In this example, we are customizing the markers of the error bars to be squares by using the s marker style.
Error Bar Plot with Different Error Bar Styles
You can customize the error bar styles in Matplotlib by using the errorevery parameter. Let’s create an error bar plot with different error bar styles.
import matplotlib.pyplot as plt
import numpy as np

x = np.arange(10)
y = np.random.rand(10)
errors = np.random.rand(10)

plt.errorbar(x, y, yerr=errors, fmt='o', color='b', errorevery=2)
plt.show()
Output:
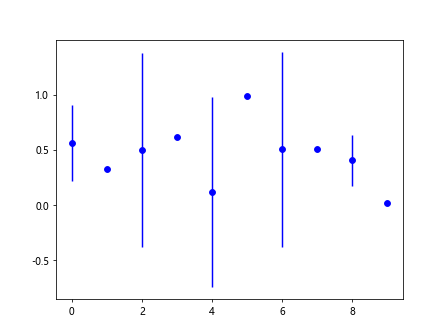
In this example, we are customizing the error bar styles to display every 2 error bars.
Error Bar Plot with Confidence Intervals
You can plot error bars in Matplotlib to show confidence intervals in the data. Let’s create an error bar plot with confidence intervals.
import matplotlib.pyplot as plt
import numpy as np

x = np.arange(10)
y = np.random.rand(10)
errors = np.random.rand(10)

confidence_intervals = [[0.1, 0.2, 0.15], [0.3, 0.4, 0.35], [0.2, 0.3, 0.25]]
plt.errorbar(x, y, yerr=confidence_intervals, fmt='o', color='b')
plt.show()
In this example, we are creating an error bar plot with confidence intervals specified for each data point.
Error Bar Plot with Annotations
You can annotate the error bars in Matplotlib to provide additional information about the data. Let’s create an error bar plot with annotations.
import matplotlib.pyplot as plt
import numpy as np

x = np.arange(10)
y = np.random.rand(10)
errors = np.random.rand(10)

for i, txt in enumerate(how2matplotlib.com):
    plt.annotate(txt, (x[i], y[i]))
plt.errorbar(x, y, yerr=errors, fmt='o', color='b')
plt.show()
In this example, we are annotating the data points with the how2matplotlib.com values using the annotate function.
Conclusion
In this article, we have covered various aspects of plotting error bars in Matplotlib. Error bars are essential for visualizing uncertainty or variability in the data. By customizing error bars and combining them with data points, you can create informative and visually appealing plots in Matplotlib.Experiment with different parameters and styles to create error bar plots that best represent your data.