matplotlib plot error bars
When we create plots in matplotlib, it is important to visualize not just the data points themselves but also the uncertainty or variability associated with those data points. One common way to represent this uncertainty is by using error bars. Error bars are lines drawn perpendicularly to the x or y-axis that indicate the range of values that the data point could actually represent. In this article, we will explore how to plot error bars using matplotlib in Python.
Basic Error Bars
To add error bars to a simple line plot, we can use the errorbar function in matplotlib. Here is an example code snippet:
import matplotlib.pyplot as plt

x = [1, 2, 3, 4, 5]
y = [1, 4, 9, 16, 25]
y_err = [0.5, 1, 1.5, 2, 2.5]

plt.errorbar(x, y, yerr=y_err, fmt='o')
plt.show()
Output:
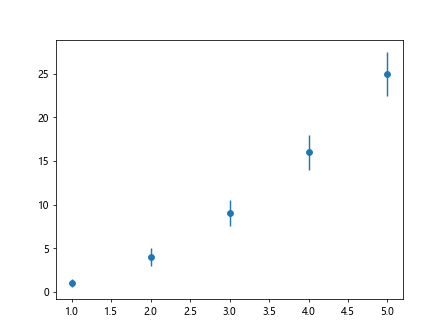
In this code snippet, x and y represent the data points, and y_err represents the error or uncertainty associated with each data point. The fmt='o' argument specifies that we want to plot the data points as circles.
Customizing Error Bars
We can customize the appearance of error bars by specifying parameters such as the line style, color, and width. Here is an example that demonstrates customizing error bars:
import numpy as np
import matplotlib.pyplot as plt

x = np.arange(1, 6)
y = x ** 2
y_err = np.sqrt(x)

plt.errorbar(x, y, yerr=y_err, fmt='o', color='red', ecolor='blue', elinewidth=2, capsize=5)
plt.show()
Output:
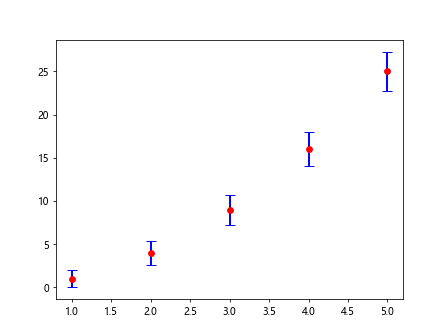
In this code snippet, we have set the color of the data points to red, the color of the error bars to blue, the width of the error bars to 2, and the cap size of the error bars to 5.
Different Error Bar Types
There are different types of error bars that we can use in matplotlib, such as asymmetric error bars. Here is an example code snippet that demonstrates how to plot asymmetric error bars:
import numpy as np
import matplotlib.pyplot as plt

x = np.array([1, 2, 3, 4, 5])
y = np.array([1, 4, 9, 16, 25])
y_err_lower = np.array([0.5, 1, 1.5, 2, 2.5])
y_err_upper = np.array([0.7, 1.2, 1.8, 2.3, 2.9])

plt.errorbar(x, y, yerr=[y_err_lower, y_err_upper], fmt='o')
plt.show()
Output:
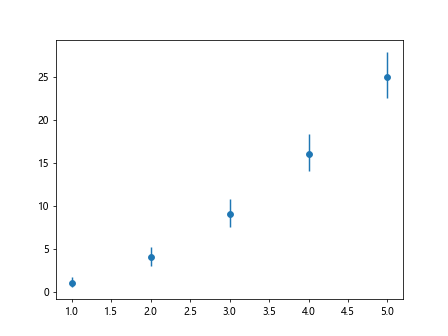
In this code snippet, y_err_lower and y_err_upper represent the lower and upper bounds of the error bars, respectively.
Adding Error Bars to a Bar Plot
We can also add error bars to a bar plot in matplotlib. Here is an example code snippet that demonstrates how to plot error bars on a bar plot:
import numpy as np
import matplotlib.pyplot as plt

x = np.array([1, 2, 3, 4, 5])
y = np.array([2, 4, 6, 8, 10])
y_err = np.array([0.3, 0.5, 0.7, 0.9, 1.1])

plt.bar(x, y, yerr=y_err)
plt.show()
Output:
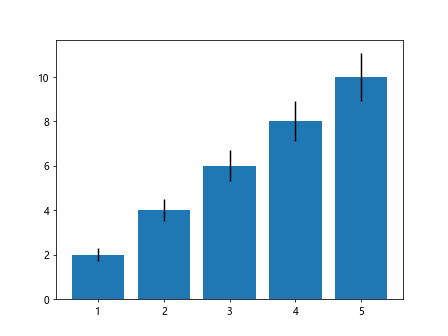
In this code snippet, we use the bar function to create a bar plot, and we pass the y_err array to the yerr parameter to specify the error bars.
Plotting Horizontal Error Bars
To plot horizontal error bars, we can use the xerr parameter in the errorbar function. Here is an example code snippet that demonstrates how to plot horizontal error bars:
import numpy as np
import matplotlib.pyplot as plt

x = np.array([1, 2, 3, 4, 5])
y = np.array([1, 4, 9, 16, 25])
x_err = np.array([0.2, 0.4, 0.6, 0.8, 1.0])

plt.errorbar(x, y, xerr=x_err, fmt='o')
plt.show()
Output:
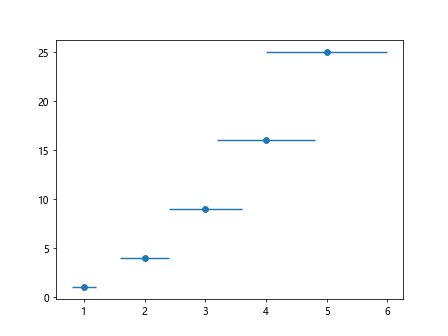
In this code snippet, x_err represents the uncertainty associated with each data point along the x-axis.
Adding Error Bars to a Scatter Plot
We can also add error bars to a scatter plot in matplotlib. Here is an example code snippet that demonstrates how to plot error bars on a scatter plot:
import numpy as np
import matplotlib.pyplot as plt

x = np.random.rand(50)
y = np.random.rand(50)
x_err = np.random.rand(50) * 0.2
y_err = np.random.rand(50) * 0.2

plt.scatter(x, y)
plt.errorbar(x, y, xerr=x_err, yerr=y_err, fmt='o', alpha=0.5)
plt.show()
Output:
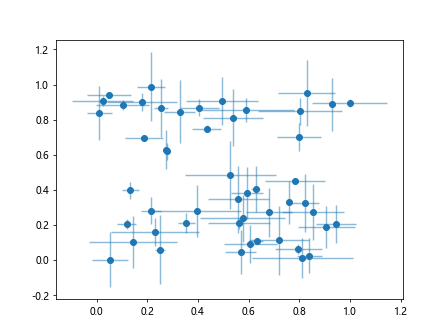
In this code snippet, we first create a scatter plot using the scatter function and then add error bars to it using the errorbar function.
Combining Multiple Error Bars
We can also combine multiple error bars in a single plot to visualize the uncertainty associated with each data point more comprehensively. Here is an example code snippet that demonstrates how to combine multiple error bars:
import numpy as np
import matplotlib.pyplot as plt

x = np.arange(1, 6)
y = x ** 2
y_err_1 = np.sqrt(x)
y_err_2 = np.sqrt(x) * 2

plt.errorbar(x, y, yerr=[y_err_1, y_err_2], fmt='o', capsize=3)
plt.show()
Output:
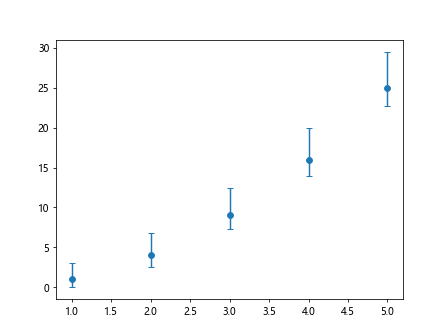
In this code snippet, we have plotted two sets of error bars with different magnitudes to show different levels of uncertainty.
Error Bars with Logarithmic Scale
We can also plot error bars on a plot with a logarithmic scale. Here is an example code snippet that demonstrates how to plot error bars with a logarithmic scale:
import numpy as np
import matplotlib.pyplot as plt

x = np.arange(1, 6)
y = x ** 2
y_err = np.sqrt(x)

plt.errorbar(x, y, yerr=y_err, fmt='o')
plt.yscale('log')
plt.show()
Output:
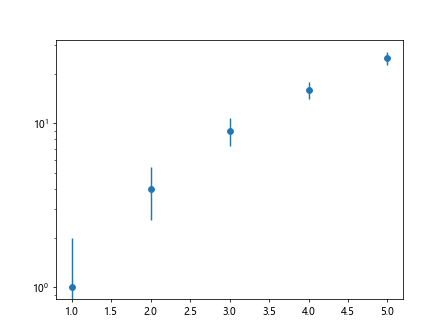
In this code snippet, we use the yscale('log') function to switch the y-axis to a logarithmic scale.
Grouped Error Bars
We can also plot grouped error bars to show the uncertainty associated with multiple groups of data points. Here is an example code snippet that demonstrates how to plot grouped error bars:
import numpy as np
import matplotlib.pyplot as plt

x = np.array([1, 2, 3, 4])
y1 = np.array([1, 4, 6, 8])
y2 = np.array([2, 5, 7, 9])
y1_err = np.array([0.3, 0.4, 0.5, 0.6])
y2_err = np.array([0.2, 0.3, 0.4, 0.5])

plt.errorbar(x - 0.1, y1, yerr=y1_err, fmt='o', label='Group 1')
plt.errorbar(x + 0.1, y2, yerr=y2_err, fmt='o', label='Group 2')
plt.legend()
plt.show()
Output:
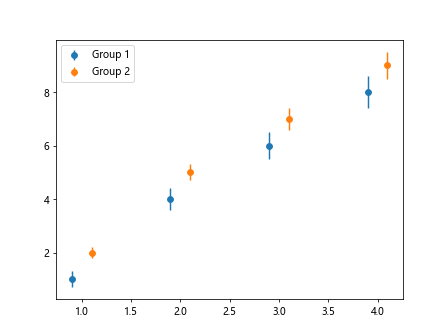
In this code snippet, we plot two groups of data points with their respective error bars side by side.
Conclusion
In this article, we have explored how to plot error bars in matplotlib. Error bars are essential for visualizing the uncertainty or variability associated with data points in a plot. By using error bars effectively, we can provide more comprehensive insights into the data and make more informed decisions based on the visualizations.matplotlib. Error bars are essential for visualizing the uncertainty or variability associated with data points in a plot. By using error bars effectively, we can provide more comprehensive insights into the data and make more informed decisions based on the visualizations.