Heatmap Plotting Using Matplotlib
In data visualization, heatmaps are commonly used to represent data in a two-dimensional format where the values are represented as colors. Matplotlib is a popular Python library for creating static, animated, and interactive visualizations. In this article, we will explore how to plot heatmaps using Matplotlib.
1. Creating a Simple Heatmap
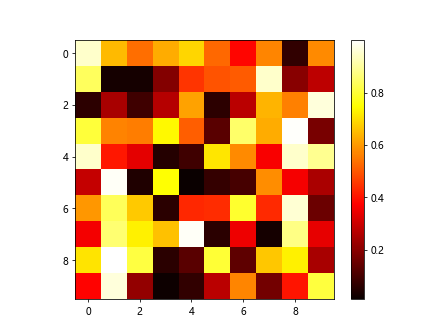
To create a simple heatmap using Matplotlib, you can use the imshow function along with a 2D array of data. Here is an example code snippet:
import matplotlib.pyplot as plt
import numpy as np

data = np.random.rand(10,10)
plt.imshow(data, cmap='hot', interpolation='nearest')
plt.colorbar()
plt.show()
Output:
2. Customizing Heatmap Colors
You can customize the colors of the heatmap by changing the colormap. Matplotlib provides a range of colormaps that you can choose from. Here is an example using the ‘cool’ colormap:
import matplotlib.pyplot as plt
import numpy as np

data = np.random.rand(10,10)
plt.imshow(data, cmap='cool', interpolation='nearest')
plt.colorbar()
plt.show()
Output:

3. Adding Annotations to Heatmap
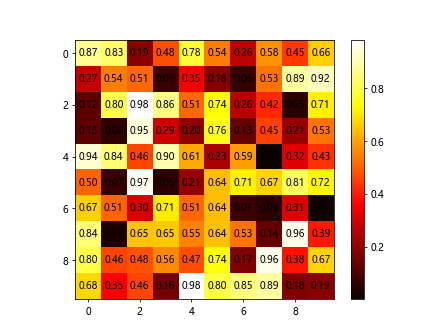
You can add annotations to the heatmap by using the text function in Matplotlib. Here is an example code snippet that adds annotations to the heatmap:
import matplotlib.pyplot as plt
import numpy as np

data = np.random.rand(10,10)
plt.imshow(data, cmap='hot', interpolation='nearest')
for i in range(10):
    for j in range(10):
        plt.text(j, i, f'{data[i,j]:.2f}', ha='center', va='center', color='black')
plt.colorbar()
plt.show()
Output:
4. Changing the Aspect Ratio of the Heatmap
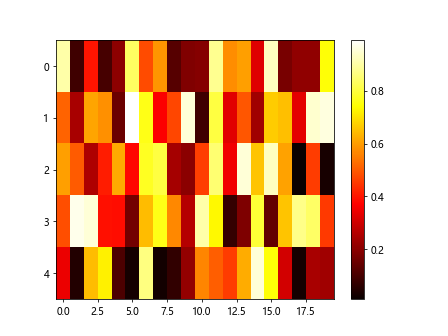
You can change the aspect ratio of the heatmap using the aspect parameter in the imshow function. Here is an example code snippet that changes the aspect ratio of the heatmap:
import matplotlib.pyplot as plt
import numpy as np

data = np.random.rand(5,20)
plt.imshow(data, cmap='hot', interpolation='nearest', aspect='auto')
plt.colorbar()
plt.show()
Output:
5. Plotting Categorical Data as a Heatmap
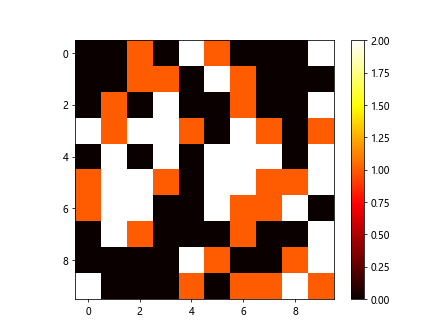
You can plot categorical data as a heatmap by converting the categories to numerical values. Here is an example code snippet that plots categorical data as a heatmap:
import matplotlib.pyplot as plt
import numpy as np

data = np.random.choice(['A', 'B', 'C'], size=(10,10))
mapping = {'A': 0, 'B': 1, 'C': 2}
numeric_data = np.vectorize(mapping.get)(data)
plt.imshow(numeric_data, cmap='hot', interpolation='nearest')
plt.colorbar()
plt.show()
Output:
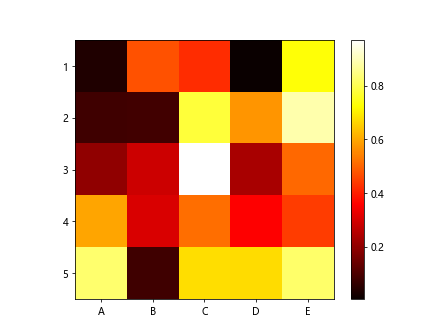
6. Adding Row and Column Labels to the Heatmap
You can add row and column labels to the heatmap using the xticks and yticks functions in Matplotlib. Here is an example code snippet that adds row and column labels to the heatmap:
import matplotlib.pyplot as plt
import numpy as np

data = np.random.rand(5,5)
plt.imshow(data, cmap='hot', interpolation='nearest')
plt.colorbar()
plt.xticks(range(5), ['A', 'B', 'C', 'D', 'E'])
plt.yticks(range(5), ['1', '2', '3', '4', '5'])
plt.show()
Output:
7. Setting Custom Tick Labels on the Colorbar
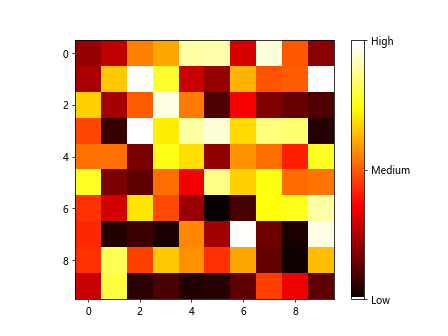
You can set custom tick labels on the colorbar by using the set_ticks and set_ticklabels functions. Here is an example code snippet that sets custom tick labels on the colorbar:
import matplotlib.pyplot as plt
import numpy as np

data = np.random.rand(10,10)
plt.imshow(data, cmap='hot', interpolation='nearest')
cbar = plt.colorbar()
cbar.set_ticks([0, 0.5, 1])
cbar.set_ticklabels(['Low', 'Medium', 'High'])
plt.show()
Output:
8. Adding Gridlines to the Heatmap
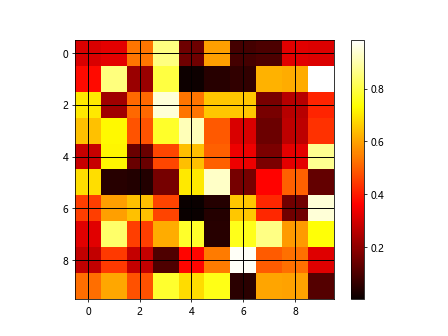
You can add gridlines to the heatmap by using the grid function in Matplotlib. Here is an example code snippet that adds gridlines to the heatmap:
import matplotlib.pyplot as plt
import numpy as np

data = np.random.rand(10,10)
plt.imshow(data, cmap='hot', interpolation='nearest')
plt.grid(True, which='both', color='black', linestyle='-', linewidth=1)
plt.colorbar()
plt.show()
Output:
9. Plotting a Symmetric Heatmap
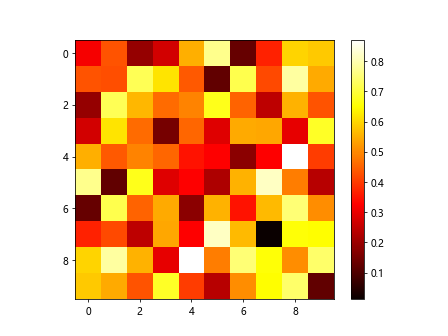
You can plot a symmetric heatmap by using a symmetric 2D array of data. Here is an example code snippet that plots a symmetric heatmap:
import matplotlib.pyplot as plt
import numpy as np

data = np.random.rand(10,10)
data = (data + data.T) / 2
plt.imshow(data, cmap='hot', interpolation='nearest')
plt.colorbar()
plt.show()
Output:
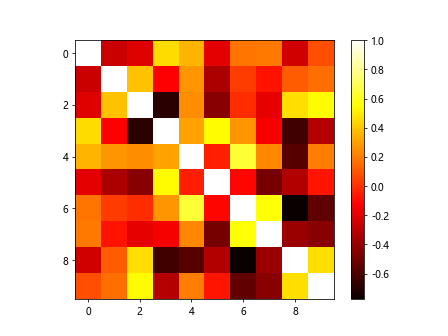
10. Plotting a Correlation Matrix as a Heatmap
You can plot a correlation matrix as a heatmap by using the corrcoef function in NumPy. Here is an example code snippet that plots a correlation matrix as a heatmap:
import matplotlib.pyplot as plt
import numpy as np

data = np.random.rand(10,10)
corr_matrix = np.corrcoef(data)
plt.imshow(corr_matrix, cmap='hot', interpolation='nearest')
plt.colorbar()
plt.show()
Output:
Conclusion
In this article, we have explored how to plot heatmaps using Matplotlib. We have covered various aspects of heatmap plotting such as customizing colors, adding annotations, changing aspect ratio, plotting categorical data, adding labels, setting custom tick labels on the colorbar, adding gridlines, plotting symmetric heatmaps, and plotting correlation matrices. By following the examples provided, you can create informative and visually appealing heatmaps for your data visualization needs.