Add a Legend in a 3D Scatterplot with scatter() in Matplotlib
Adding a legend to a 3D scatterplot in Matplotlib can enhance the readability and interpretability of the plot by providing a clear indication of what each set of points represents. This article will guide you through the process of creating 3D scatterplots and adding legends using Matplotlib, a powerful plotting library in Python. We will cover various scenarios and customization options for legends in 3D scatterplots, providing detailed examples along the way.
Introduction to 3D Scatterplots in Matplotlib
Before diving into the specifics of adding legends, it’s important to understand how to create a basic 3D scatterplot using Matplotlib. Matplotlib’s mpl_toolkits.mplot3d module allows for the creation of 3D axes to plot various types of 3D graphs.
Example 1: Basic 3D Scatterplot
import matplotlib.pyplot as plt
from mpl_toolkits.mplot3d import Axes3D
import numpy as np

# Creating data
x = np.random.standard_normal(100)
y = np.random.standard_normal(100)
z = np.random.standard_normal(100)

# Creating a figure
fig = plt.figure()
ax = fig.add_subplot(111, projection='3d')

# Plotting data
scatter = ax.scatter(x, y, z, c='r', label='Red Points how2matplotlib.com')

# Showing the plot
plt.show()
Output:
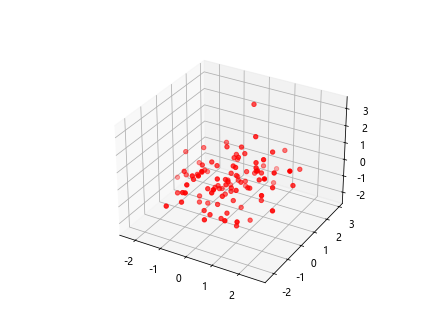
Adding a Legend to a 3D Scatterplot
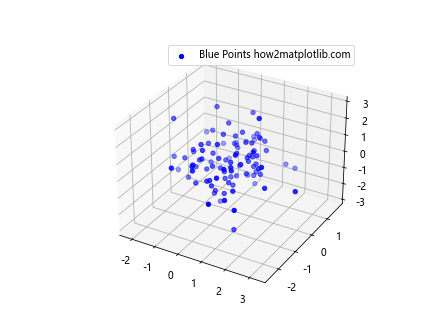
Adding a legend to a 3D scatterplot involves using the legend() method of the Axes object. This method automatically detects the labels assigned to each dataset.
Example 2: Adding a Simple Legend
import matplotlib.pyplot as plt
from mpl_toolkits.mplot3d import Axes3D
import numpy as np

# Creating data
x = np.random.standard_normal(100)
y = np.random.standard_normal(100)
z = np.random.standard_normal(100)

# Creating a figure
fig = plt.figure()
ax = fig.add_subplot(111, projection='3d')

# Plotting data
scatter = ax.scatter(x, y, z, c='b', label='Blue Points how2matplotlib.com')

# Adding a legend
ax.legend()

# Showing the plot
plt.show()
Output:
Example 3: Customizing Legend Location
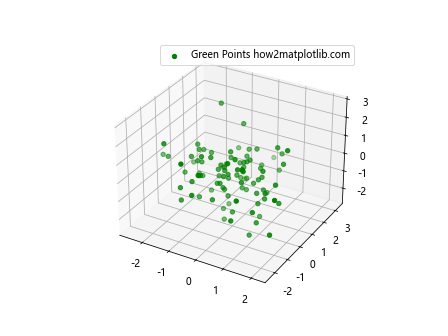
You can customize the location of the legend in the plot by using the loc parameter of the legend() method.
import matplotlib.pyplot as plt
from mpl_toolkits.mplot3d import Axes3D
import numpy as np

# Creating data
x = np.random.standard_normal(100)
y = np.random.standard_normal(100)
z = np.random.standard_normal(100)

# Creating a figure
fig = plt.figure()
ax = fig.add_subplot(111, projection='3d')

# Plotting data
scatter = ax.scatter(x, y, z, c='g', label='Green Points how2matplotlib.com')

# Adding a legend with custom location
ax.legend(loc='upper right')

# Showing the plot
plt.show()
Output:
Example 4: Multiple Data Sets with Legends
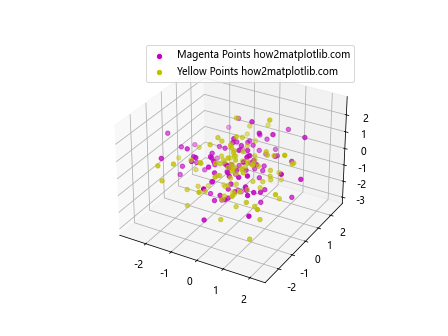
When plotting multiple datasets, you can add a label to each dataset and Matplotlib will automatically handle them in the legend.
import matplotlib.pyplot as plt
from mpl_toolkits.mplot3d import Axes3D
import numpy as np

# Creating data for two sets
x1, y1, z1 = np.random.standard_normal(100), np.random.standard_normal(100), np.random.standard_normal(100)
x2, y2, z2 = np.random.standard_normal(100), np.random.standard_normal(100), np.random.standard_normal(100)

# Creating a figure
fig = plt.figure()
ax = fig.add_subplot(111, projection='3d')

# Plotting first dataset
scatter1 = ax.scatter(x1, y1, z1, c='m', label='Magenta Points how2matplotlib.com')

# Plotting second dataset
scatter2 = ax.scatter(x2, y2, z2, c='y', label='Yellow Points how2matplotlib.com')

# Adding a legend
ax.legend()

# Showing the plot
plt.show()
Output:
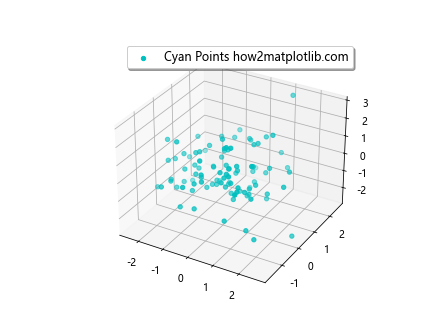
Example 5: Customizing Legend Appearance
You can customize the appearance of the legend by passing additional parameters such as fontsize and shadow.
import matplotlib.pyplot as plt
from mpl_toolkits.mplot3d import Axes3D
import numpy as np

# Creating data
x = np.random.standard_normal(100)
y = np.random.standard_normal(100)
z = np.random.standard_normal(100)

# Creating a figure
fig = plt.figure()
ax = fig.add_subplot(111, projection='3d')

# Plotting data
scatter = ax.scatter(x, y, z, c='c', label='Cyan Points how2matplotlib.com')

# Customizing the legend
ax.legend(fontsize='large', shadow=True)

# Showing the plot
plt.show()
Output:
Advanced Legend Customization
For more complex scenarios, such as adding a legend outside the plot or customizing the legend’s border, Matplotlib provides extensive options to fine-tune the appearance and behavior of legends.
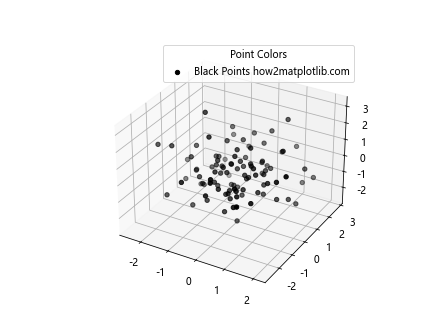
Example 6: Legend with Title
Adding a title to the legend can provide additional context.
import matplotlib.pyplot as plt
from mpl_toolkits.mplot3d import Axes3D
import numpy as np

# Creating data
x = np.random.standard_normal(100)
y = np.random.standard_normal(100)
z = np.random.standard_normal(100)

# Creating a figure
fig = plt.figure()
ax = fig.add_subplot(111, projection='3d')

# Plotting data
scatter = ax.scatter(x, y, z, c='k', label='Black Points how2matplotlib.com')

# Adding a legend with a title
ax.legend(title='Point Colors')

# Showing the plot
plt.show()
Output:
Example 7: Legend with Custom Handler
For more control over how items are represented in the legend, you can use custom legend handlers.
import matplotlib.pyplot as plt
from mpl_toolkits.mplot3d import Axes3D
from matplotlib.legend_handler import HandlerLine2D
import numpy as np

# Creating data
x = np.random.standard_normal(100)
y = np.random.standard_normal(100)
z = np.random.standard_normal(100)

# Creating a figure
fig = plt.figure()
ax = fig.add_subplot(111, projection='3d')

# Plotting data
scatter = ax.scatter(x, y, z, c='orange', label='Orange Points how2matplotlib.com')

# Custom handler
handler = HandlerLine2D(numpoints=4)

# Adding a legend with a custom handler
ax.legend(handler_map={scatter: handler})

# Showing the plot
plt.show()
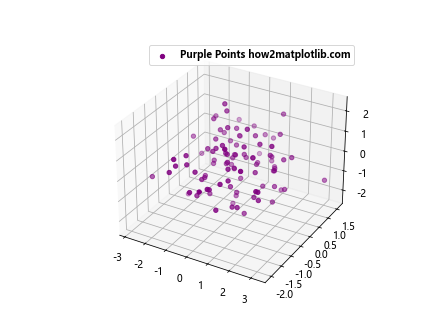
Example 8: Legend with Custom Font Properties
You can specify custom font properties for the text in the legend.
import matplotlib.pyplot as plt
from mpl_toolkits.mplot3d import Axes3D
import numpy as np
from matplotlib.font_manager import FontProperties

# Creating data
x = np.random.standard_normal(100)
y = np.random.standard_normal(100)
z = np.random.standard_normal(100)

# Creating a figure
fig = plt.figure()
ax = fig.add_subplot(111, projection='3d')

# Plotting data
scatter = ax.scatter(x, y, z, c='purple', label='Purple Points how2matplotlib.com')

# Custom font properties
font_prop = FontProperties(size=10, style='italic', weight='bold')

# Adding a legend with custom font properties
ax.legend(prop=font_prop)

# Showing the plot
plt.show()
Output:
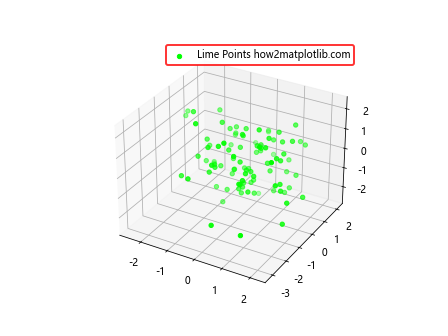
Example 9: Legend with Custom Border Color and Width
You can customize the border color and width of the legend box.
import matplotlib.pyplot as plt
from mpl_toolkits.mplot3d import Axes3D
import numpy as np

# Creating data
x = np.random.standard_normal(100)
y = np.random.standard_normal(100)
z = np.random.standard_normal(100)

# Creating a figure
fig = plt.figure()
ax = fig.add_subplot(111, projection='3d')

# Plotting data
scatter = ax.scatter(x, y, z, c='lime', label='Lime Points how2matplotlib.com')

# Customizing the legend border
legend = ax.legend()
legend.get_frame().set_edgecolor('red')
legend.get_frame().set_linewidth(2)

# Showing the plot
plt.show()
Output:
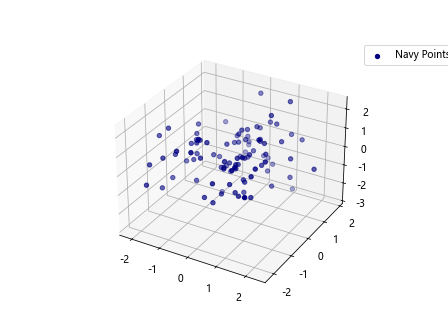
Example 10: Placing the Legend Outside the Plot
Sometimes, placing the legend inside the plot can obscure data. You can place the legend outside the plot area to avoid this.
import matplotlib.pyplot as plt
from mpl_toolkits.mplot3d import Axes3D
import numpy as np

# Creating data
x = np.random.standard_normal(100)
y = np.random.standard_normal(100)
z = np.random.standard_normal(100)

# Creating a figure
fig = plt.figure()
ax = fig.add_subplot(111, projection='3d')

# Plotting data
scatter = ax.scatter(x, y, z, c='navy', label='Navy Points how2matplotlib.com')

# Placing the legend outside the plot
ax.legend(loc='upper left', bbox_to_anchor=(1, 1))

# Showing the plot
plt.show()
Output:
Example 11: Using Multiple Legends
For complex plots with multiple categories, you might want to use more than one legend.
import matplotlib.pyplot as plt
from mpl_toolkits.mplot3d import Axes3D
import numpy as np

# Creating data for three sets
x1, y1, z1 = np.random.standard_normal(100), np.random.standard_normal(100), np.random.standard_normal(100)
x2, y2, z2 = np.random.standard_normal(100), np.random.standard_normal(100), np.random.standard_normal(100)
x3, y3, z3 = np.random.standard_normal(100), np.random.standard_normal(100), np.random.standard_normal(100)

# Creating a figure
fig = plt.figure()
ax = fig.add_subplot(111, projection='3d')

# Plotting data
scatter1 = ax.scatter(x1, y1, z1, c='gold', label='Gold Points how2matplotlib.com')
scatter2 = ax.scatter(x2, y2, z2, c='silver', label='Silver Points how2matplotlib.com')
scatter3 = ax.scatter(x3, y3, z3, c='bronze', label='Bronze Points how2matplotlib.com')

# Adding the first legend
first_legend = ax.legend(handles=[scatter1], loc='upper left')
ax.add_artist(first_legend)

# Adding the second legend
ax.legend(handles=[scatter2, scatter3], loc='upper right')

# Showing the plot
plt.show()
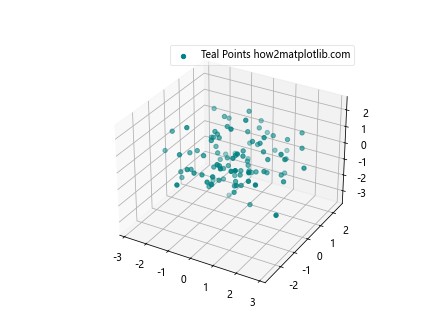
Example 12: Legend with Transparent Background
Enhancing the appearance of the legend by making its background transparent can be visually appealing.
import matplotlib.pyplot as plt
from mpl_toolkits.mplot3d import Axes3D
import numpy as np

# Creating data
x = np.random.standard_normal(100)
y = np.random.standard_normal(100)
z = np.random.standard_normal(100)

# Creating a figure
fig = plt.figure()
ax = fig.add_subplot(111, projection='3d')

# Plotting data
scatter = ax.scatter(x, y, z, c='teal', label='Teal Points how2matplotlib.com')

# Adding a legend with a transparent background
legend = ax.legend()
legend.get_frame().set_alpha(0.5)

# Showing the plot
plt.show()
Output:
Example 13: Customizing Legend Markers
Customizing the markers in the legend to match or differ from the plot can help in making the plot more informative.
import matplotlib.pyplot as plt
from mpl_toolkits.mplot3d import Axes3D
import numpy as np

# Creating data
x = np.random.standard_normal(100)
y = np.random.standard_normal(100)
z = np.random.standard_normal(100)

# Creating a figure
fig = plt.figure()
ax = fig.add_subplot(111, projection='3d')

# Plotting data
scatter = ax.scatter(x, y, z, c='olive', marker='^', label='Olive Triangles how2matplotlib.com')

# Adding a legend with customized markers
legend = ax.legend()
for handle in legend.legendHandles:
    handle.set_marker('s')

# Showing the plot
plt.show()
These examples illustrate various ways to add and customize legends in 3D scatterplots using Matplotlib. By effectively using legends, you can make your 3D visualizations clearer and more useful for data interpretation.