Matplotlib pip install
Matplotlib is a popular data visualization library in Python that allows users to create various types of plots such as line plots, bar plots, scatter plots, histograms, and more. In this article, we will discuss how to install Matplotlib using pip.
What is pip?
pip is a package management system used to install and manage software packages written in Python. It is the standard package manager for Python and comes pre-installed with the Python distribution.
To install Matplotlib using pip, follow the steps below:
- Open a terminal or command prompt.
- Run the following command to install Matplotlib:
pip install matplotlib
This command will download and install the latest version of Matplotlib along with any required dependencies.
Examples
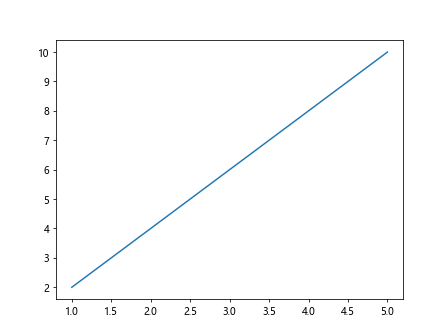
Example 1: Plotting a Line Graph
import matplotlib.pyplot as plt

x = [1, 2, 3, 4, 5]
y = [2, 4, 6, 8, 10]

plt.plot(x, y)
plt.show()
Output:
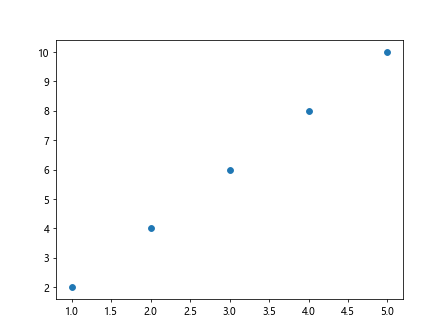
Example 2: Creating a Scatter Plot
import matplotlib.pyplot as plt

x = [1, 2, 3, 4, 5]
y = [2, 4, 6, 8, 10]

plt.scatter(x, y)
plt.show()
Output:
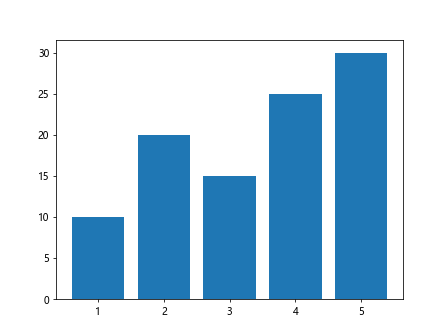
Example 3: Displaying a Bar Chart
import matplotlib.pyplot as plt

x = [1, 2, 3, 4, 5]
y = [10, 20, 15, 25, 30]

plt.bar(x, y)
plt.show()
Output:
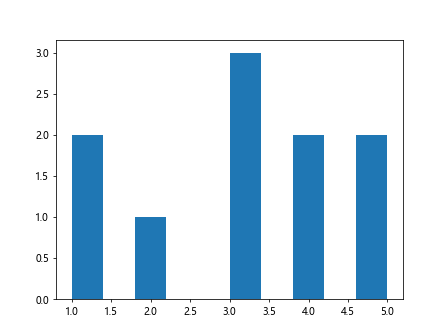
Example 4: Generating a Histogram
import matplotlib.pyplot as plt

data = [1, 1, 2, 3, 3, 3, 4, 4, 5, 5]

plt.hist(data)
plt.show()
Output:
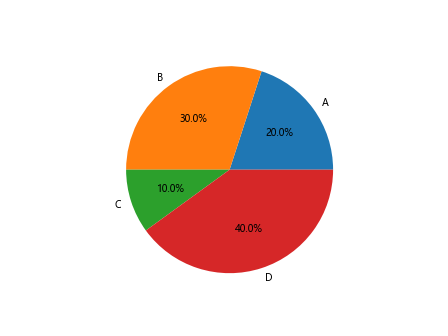
Example 5: Plotting a Pie Chart
import matplotlib.pyplot as plt

sizes = [20, 30, 10, 40]

plt.pie(sizes, labels=['A', 'B', 'C', 'D'], autopct='%1.1f%%')
plt.show()
Output:
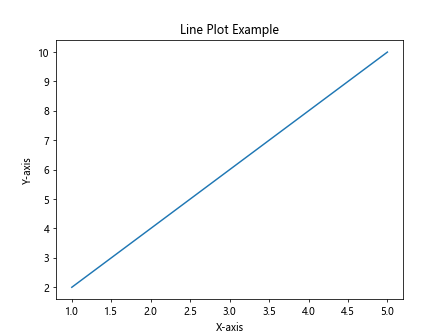
Example 6: Adding Titles and Labels
import matplotlib.pyplot as plt

x = [1, 2, 3, 4, 5]
y = [2, 4, 6, 8, 10]

plt.plot(x, y)
plt.title('Line Plot Example')
plt.xlabel('X-axis')
plt.ylabel('Y-axis')
plt.show()
Output:
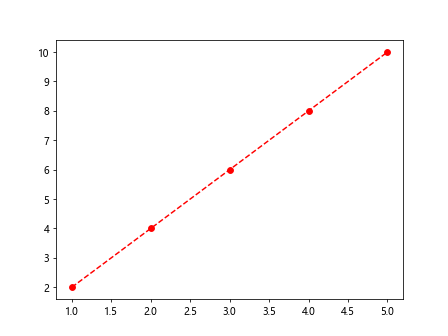
Example 7: Customizing Plot Appearance
import matplotlib.pyplot as plt

x = [1, 2, 3, 4, 5]
y = [2, 4, 6, 8, 10]

plt.plot(x, y, color='red', linestyle='dashed', marker='o')
plt.show()
Output:
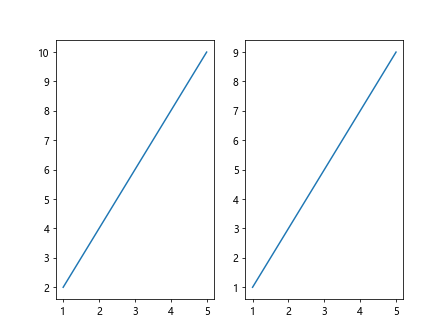
Example 8: Creating Subplots
import matplotlib.pyplot as plt

x = [1, 2, 3, 4, 5]
y1 = [2, 4, 6, 8, 10]
y2 = [1, 3, 5, 7, 9]

plt.subplot(1, 2, 1)
plt.plot(x, y1)

plt.subplot(1, 2, 2)
plt.plot(x, y2)
plt.show()
Output:
Example 9: Saving Plots as Image Files
import matplotlib.pyplot as plt

x = [1, 2, 3, 4, 5]
y = [2, 4, 6, 8, 10]

plt.plot(x, y)
plt.savefig('plot.png')
Example 10: Using LaTeX for Math Symbols
import matplotlib.pyplot as plt

plt.title(r'$\alpha > \beta$')
plt.show()
Output:
Conclusion
In this article, we discussed how to install Matplotlib using pip and provided several examples of how to create different types of plots using Matplotlib. Matplotlib is a powerful tool for data visualization in Python and can be customized to create a wide variety of visualizations. Installing Matplotlib using pip is straightforward and allows users to quickly start creating plots in Python.