Matplotlib Line Colors
Matplotlib is a popular data visualization library in Python that provides a wide range of options for customizing the appearance of plots. One key aspect of creating visually appealing plots is choosing the right colors for the lines. In this article, we will explore different ways to specify line colors in Matplotlib.
Using Named Colors
Matplotlib provides a set of named colors that can be directly referenced when plotting lines. These named colors include common colors like ‘red’, ‘blue’, ‘green’, etc. Let’s see an example:
import matplotlib.pyplot as plt

x = [1, 2, 3, 4, 5]
y = [1, 4, 9, 16, 25]

plt.plot(x, y, color='blue')
plt.show()
Output:

In this example, we specify the line color as ‘blue’ using the color parameter.
Using Hex Colors
You can also specify line colors using hexadecimal color codes. This allows you to choose from a much wider range of colors. Here’s an example:
import matplotlib.pyplot as plt

x = [1, 2, 3, 4, 5]
y = [1, 4, 9, 16, 25]

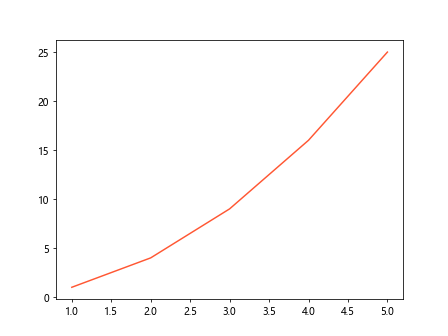
plt.plot(x, y, color='#ff5733')
plt.show()
Output:

In this example, we specify the line color using the hexadecimal color code #ff5733.
Using RGB Colors
Another way to specify line colors in Matplotlib is using RGB values. Each color channel (red, green, blue) is represented by a number between 0 and 1. Here’s an example:
import matplotlib.pyplot as plt

x = [1, 2, 3, 4, 5]
y = [1, 4, 9, 16, 25]

plt.plot(x, y, color=(0.2, 0.4, 0.6))
plt.show()
Output:

In this example, we specify the line color using RGB values (0.2, 0.4, 0.6).
Using RGBA Colors
You can also specify line colors with an additional alpha channel to control transparency. The alpha channel ranges from 0 (fully transparent) to 1 (fully opaque). Here’s an example:
import matplotlib.pyplot as plt

x = [1, 2, 3, 4, 5]
y = [1, 4, 9, 16, 25]

plt.plot(x, y, color=(0.1, 0.5, 0.8, 0.7))
plt.show()
Output:

In this example, we specify the line color using RGBA values (0.1, 0.5, 0.8, 0.7).
Using Colormaps
Matplotlib also provides colormaps that can be used to assign colors to lines based on a numerical value. Let’s see an example using the ‘viridis’ colormap:
import matplotlib.pyplot as plt
import numpy as np

x = np.linspace(0, 10, 100)
y = np.sin(x)

plt.plot(x, y, cmap='viridis')
plt.show()
In this example, the line color is automatically determined by the ‘viridis’ colormap based on the values of y.
Using Line Styles
In addition to specifying line colors, you can also customize the line style in Matplotlib. Here are some common line styles:
- Solid line:
plt.plot(x, y, linestyle='-') - Dashed line:
plt.plot(x, y, linestyle='--') - Dotted line:
plt.plot(x, y, linestyle=':') - Dash-dot line:
plt.plot(x, y, linestyle='-.'
You can combine line styles with different colors to create visually appealing plots.
Conclusion
In this article, we have explored different ways to specify line colors in Matplotlib. By choosing the right colors and styles for your lines, you can create informative and visually appealing plots for your data visualization needs. Experiment with the examples provided here to customize the appearance of your plots in Matplotlib.