Matplotlib Color List
Matplotlib is a popular Python library for creating static, animated, and interactive visualizations in Python. When creating plots using Matplotlib, colors play a crucial role in conveying information effectively. Matplotlib provides a wide range of colors to choose from, making it easy to customize the appearance of your plots. In this article, we will explore the predefined color options available in Matplotlib and how you can use them in your visualizations.
Predefined Color Names
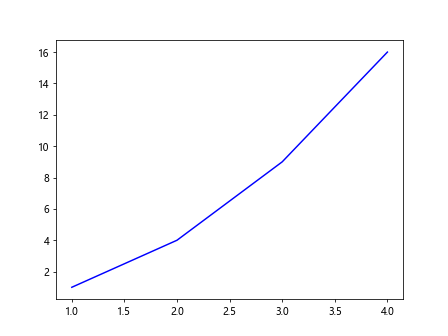
Matplotlib provides a set of predefined color names that you can use to specify colors in your plots. These colors can be directly referenced by their name in Matplotlib functions. Here is an example of how you can use predefined color names in Matplotlib:
import matplotlib.pyplot as plt

# Plot a simple line chart with a specific color
plt.plot([1, 2, 3, 4], [1, 4, 9, 16], color='blue')
plt.show()
Output:
Named Colors Example
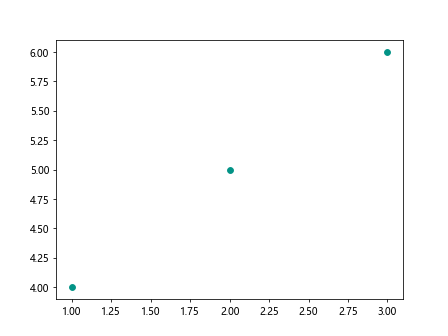
In addition to predefined color names, Matplotlib also provides a list of named colors that you can use to specify colors in your plots. These named colors are displayed in a color map called xkcd. Here is an example of how you can use named colors in Matplotlib:
import matplotlib.pyplot as plt

# Plot a simple scatter plot with a named color
plt.scatter([1, 2, 3], [4, 5, 6], c='xkcd:teal')
plt.show()
Output:
Color Palettes
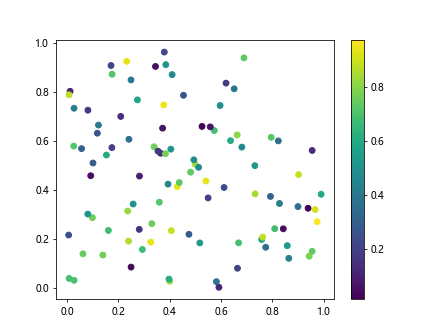
Color palettes are a collection of colors that are used to create visually appealing plots with distinct color combinations. Matplotlib offers various color palettes that you can use to customize the colors in your plots. Here is an example of how you can use a color palette in Matplotlib:
import matplotlib.pyplot as plt
import numpy as np

# Generate random data
x = np.random.rand(100)
y = np.random.rand(100)
colors = np.random.rand(100)

plt.scatter(x, y, c=colors, cmap='viridis')
plt.colorbar()  # Show color scale
plt.show()
Output:
Colormaps
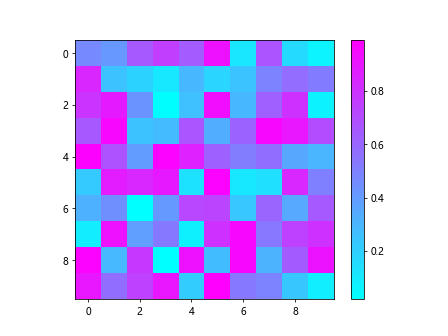
Colormaps are an essential tool for visualizing data in Matplotlib. A colormap is a mapping of scalar values to colors that are used in visualizations. Matplotlib provides a variety of colormaps that you can use to represent your data effectively. Here is an example of how you can use a colormap in Matplotlib:
import matplotlib.pyplot as plt
import numpy as np

# Generate random data
data = np.random.rand(10, 10)

plt.imshow(data, cmap='cool')
plt.colorbar()  # Show color scale
plt.show()
Output:
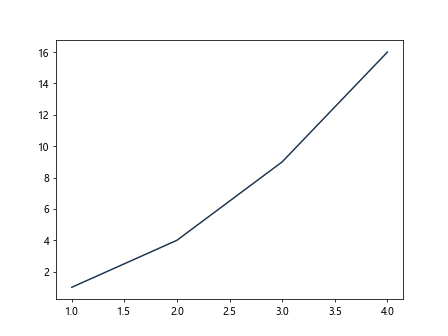
Customizing Colors
In addition to using predefined colors and colormaps, you can also customize the colors in your plots by specifying RGB or RGBA values. This allows you to create unique color combinations that are not available in the predefined color lists. Here is an example of how you can customize colors in Matplotlib:
import matplotlib.pyplot as plt

# Plot a simple line chart with a custom color
plt.plot([1, 2, 3, 4], [1, 4, 9, 16], color=(0.1, 0.2, 0.3))
plt.show()
Output:
Colorbar
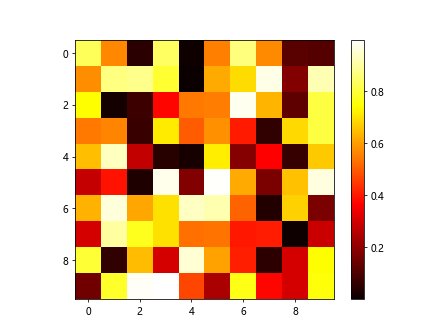
A colorbar is a visual representation of the mapping between data values and colors in a plot. It provides a reference scale for the colors used in the plot, making it easier to interpret the data. Matplotlib allows you to add colorbars to your plots using the colorbar function. Here is an example of how you can add a colorbar to a plot in Matplotlib:
import matplotlib.pyplot as plt
import numpy as np

# Generate random data
data = np.random.rand(10, 10)

plt.imshow(data, cmap='hot')
plt.colorbar()  # Show color scale
plt.show()
Output:
Discrete Colormaps
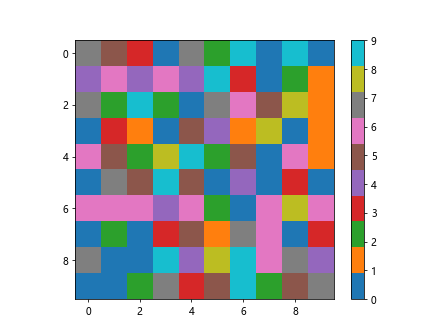
In some cases, you may want to use discrete colors in your plots to represent different categories or groups in the data. Matplotlib offers discrete colormaps that map a set of discrete values to specific colors. Here is an example of how you can use a discrete colormap in Matplotlib:
import matplotlib.pyplot as plt
import numpy as np

# Generate random data
data = np.random.randint(0, 10, size=(10, 10))

plt.imshow(data, cmap='tab10', interpolation='nearest')
plt.colorbar()  # Show color scale
plt.show()
Output:
Color Cycling
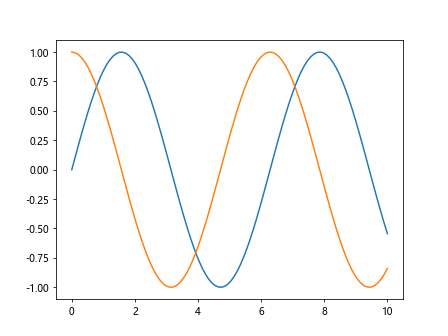
Color cycling is a feature in Matplotlib that allows you to automatically cycle through a predefined set of colors when plotting multiple datasets on the same axes. This ensures that each dataset is represented with a distinct color, making it easier to distinguish between them. Here is an example of how you can enable color cycling in Matplotlib:
import matplotlib.pyplot as plt
import numpy as np

x = np.linspace(0, 10, 100)
y1 = np.sin(x)
y2 = np.cos(x)

plt.plot(x, y1)
plt.plot(x, y2)
plt.gca().set_prop_cycle(color=['red', 'green'])  # Enable color cycling
plt.show()
Output:
Color Transparency
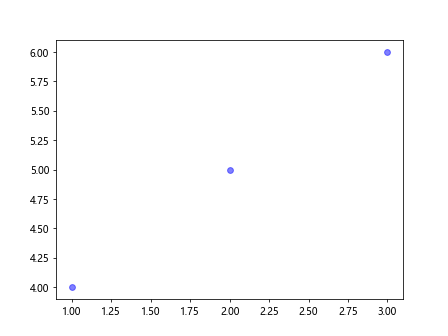
Transparency, also known as alpha blending, is a property that allows you to control the opacity of colors in your plots. It can be useful when overlaying multiple plots or visualizing data points with varying levels of importance. Matplotlib allows you to specify the transparency level of colors using RGBA values. Here is an example of how you can use transparency in Matplotlib:
import matplotlib.pyplot as plt

# Plot a scatter plot with transparent colors
plt.scatter([1, 2, 3], [4, 5, 6], c='blue', alpha=0.5)
plt.show()
Output:
Colorbar Tick Labels
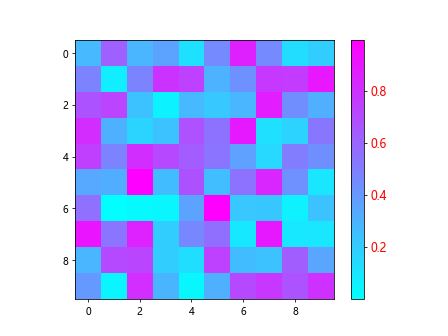
When using a colorbar in a plot, you may want to customize the tick labels to make them more informative and visually appealing. Matplotlib provides various options for customizing colorbar tick labels, such as changing the font size, color, and alignment. Here is an example of how you can customize colorbar tick labels in Matplotlib:
import matplotlib.pyplot as plt
import numpy as np

# Generate random data
data = np.random.rand(10, 10)

plt.imshow(data, cmap='cool')
cbar = plt.colorbar()  # Show color scale
cbar.ax.tick_params(labelsize=12, labelcolor='red')
plt.show()
Output:
Conclusion
In this article, we have explored the various color options available in Matplotlib, including predefined color names, color palettes, colormaps, custom colors, colorbars, discrete colormaps, color cycling, transparency, and colorbar tick labels. By leveraging these color options, you can create visually appealing and informative plots that effectively convey your data. Experiment with different color combinations and customization options to enhance the visual impact of your Matplotlib visualizations.