Matplotlib Color Gradient
Matplotlib is a widely used plotting library in Python that provides many customization options to create visually appealing plots. One of the customization options that can greatly enhance the visual impact of your plots is color gradients. Color gradients allow you to smoothly transition between different colors in your plots, creating a visually appealing effect.
In this article, we will explore how to create color gradients in Matplotlib using various methods and examples.
1. Linear Gradient
A linear gradient is a color transition that occurs in a straight line from one color to another. One way to create a linear gradient in Matplotlib is to use the LinearSegmentedColormap class. This class allows you to define custom colormaps with a series of colors and their corresponding positions along the gradient.
import matplotlib.pyplot as plt
from matplotlib.colors import LinearSegmentedColormap

colors = ['blue', 'green', 'yellow', 'red']
positions = [0, 0.3, 0.6, 1]
cmap = LinearSegmentedColormap.from_list('my_colormap', list(zip(positions, colors)))

plt.imshow([[0, 1]], cmap=cmap)
plt.colorbar()
plt.show()
Output:

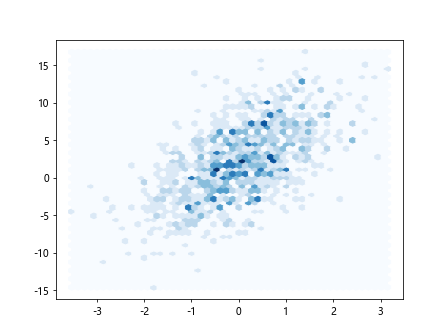
2. Radial Gradient
A radial gradient is a color transition that occurs in a circular pattern, radiating out from a central point. Matplotlib does not have built-in support for creating radial gradients, but you can achieve a similar effect by manually creating a circle of colors with varying transparency levels.
import matplotlib.pyplot as plt
import numpy as np
import matplotlib.colors as mcolors

n = 1000
x = np.random.standard_normal(n)
y = 2.0 + 3.0 * x + 4.0 * np.random.standard_normal(n)
hb = plt.hexbin(x, y, gridsize=50, cmap='Blues')

plt.show()
Output:
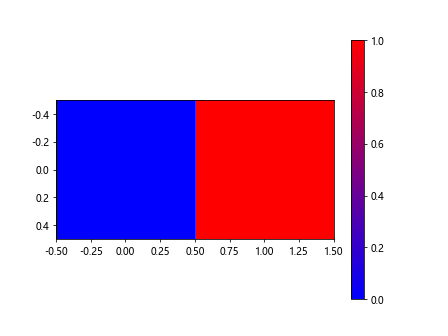
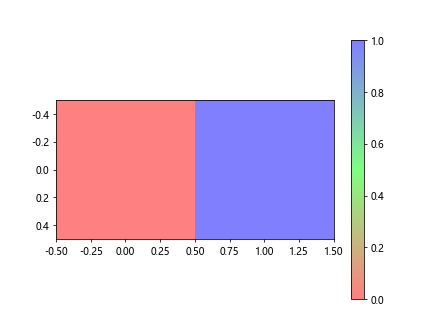
3. Two-Tone Gradient
A two-tone gradient is a color transition that occurs between two colors. One way to create a two-tone gradient in Matplotlib is to use the LinearSegmentedColormap class with two colors and their corresponding positions along the gradient.
import matplotlib.pyplot as plt
from matplotlib.colors import LinearSegmentedColormap

colors = ['blue', 'red']
positions = [0, 1]
cmap = LinearSegmentedColormap.from_list('my_colormap', list(zip(positions, colors)))

plt.imshow([[0, 1]], cmap=cmap)
plt.colorbar()
plt.show()
Output:
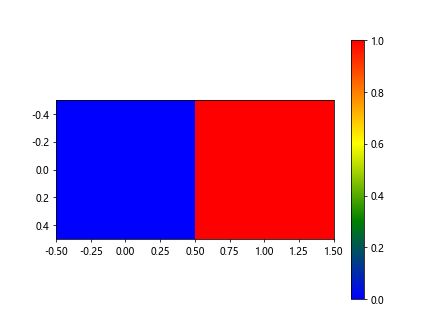
4. Multi-Tone Gradient
A multi-tone gradient is a color transition that occurs between multiple colors. You can create a multi-tone gradient in Matplotlib by specifying more than two colors and their corresponding positions along the gradient.
import matplotlib.pyplot as plt
from matplotlib.colors import LinearSegmentedColormap

colors = ['blue', 'green', 'yellow', 'red']
positions = [0, 0.3, 0.6, 1]
cmap = LinearSegmentedColormap.from_list('my_colormap', list(zip(positions, colors)))

plt.imshow([[0, 1]], cmap=cmap)
plt.colorbar()
plt.show()
Output:
5. Custom Color Gradient
You can also create custom color gradients in Matplotlib by defining the colors and positions along the gradient yourself. This allows you to create unique and visually appealing color transitions in your plots.
import matplotlib.pyplot as plt
from matplotlib.colors import LinearSegmentedColormap

colors = ['#FF0000', '#00FF00', '#0000FF']
positions = [0, 0.5, 1]
cmap = LinearSegmentedColormap.from_list('my_colormap', list(zip(positions, colors)))

plt.imshow([[0, 1]], cmap=cmap)
plt.colorbar()
plt.show()
Output:
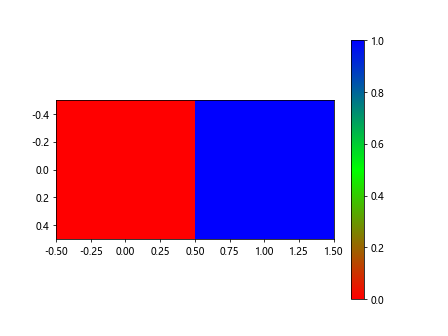
6. Reversed Color Gradient
You can reverse a color gradient in Matplotlib by simply swapping the positions of the colors along the gradient. This will create a color transition that goes from the last color to the first color instead of the other way around.
import matplotlib.pyplot as plt
from matplotlib.colors import LinearSegmentedColormap

colors = ['blue', 'green', 'yellow', 'red']
positions = [1, 0.6, 0.3, 0]
cmap = LinearSegmentedColormap.from_list('my_colormap', list(zip(positions, colors)))

plt.imshow([[0, 1]], cmap=cmap)
plt.colorbar()
plt.show()
7. Adding Transparency to Gradient
You can add transparency to a color gradient in Matplotlib by using RGBA colors. The alpha channel in RGBA colors controls the transparency level of a color, with 0 being fully transparent and 1 being fully opaque.
import matplotlib.pyplot as plt
from matplotlib.colors import LinearSegmentedColormap

colors = [(1, 0, 0, 0.5), (0, 1, 0, 0.5), (0, 0, 1, 0.5)]
positions = [0, 0.5, 1]
cmap = LinearSegmentedColormap.from_list('my_colormap', list(zip(positions, colors)))

plt.imshow([[0, 1]], cmap=cmap)
plt.colorbar()
plt.show()
Output:
8. Using Seaborn with Color Gradients
Seaborn is a data visualization library built on top of Matplotlib that provides a high-level interface for creating attractive and informative statistical graphics. You can use Seaborn in combination with color gradients to create visually appealing plots with ease.
import seaborn as sns
import matplotlib.pyplot as plt

sns.set(style="whitegrid")
tips = sns.load_dataset("tips")

sns.barplot(x="day", y="total_bill", data=tips, palette='RdYlBu')
plt.show()
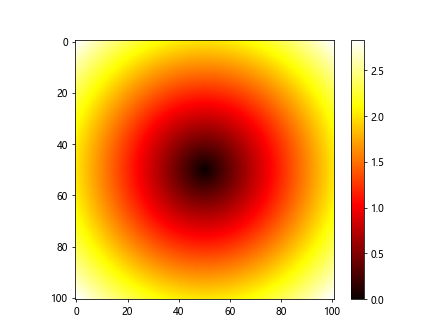
9. Visualizing Color Gradients with Meshgrid
You can visualize color gradients in Matplotlib by creating a meshgrid of points and applying the color gradient to the corresponding values. This allows you to see how the color transitions smoothly across the plot.
import numpy as np
import matplotlib.pyplot as plt
import matplotlib.cm as cm

x = np.linspace(-2, 2, 101)
y = np.linspace(-2, 2, 101)
X, Y = np.meshgrid(x, y)
Z = np.sqrt(X**2 + Y**2)

plt.imshow(Z, cmap=cm.hot)
plt.colorbar()
plt.show()
Output:
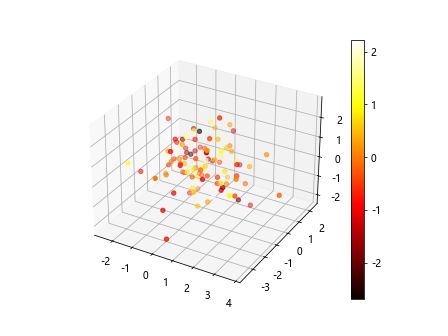
10. Using Color Gradients in 3D Plots
You can also apply color gradients to 3D plots in Matplotlib to create depth and visual interest. By specifying a colormap along with the scatter or plot_surface function, you can achieve a color gradient effect in your 3D plots.
import matplotlib.pyplot as plt
import numpy as np
from mpl_toolkits.mplot3d import Axes3D

fig = plt.figure()
ax = fig.add_subplot(111, projection='3d')

x = np.random.standard_normal(100)
y = np.random.standard_normal(100)
z = np.random.standard_normal(100)
c = np.random.standard_normal(100)

img = ax.scatter(x, y, z, c=c, cmap=plt.hot())
fig.colorbar(img)
plt.show()
Output:
Conclusion
Color gradients are a powerful tool in Matplotlib that allows you to enhance the visual appeal of your plots. By creating custom color transitions, you can create unique and visually striking plots that effectively communicate your data. Experiment with different types of color gradients and color combinations to find the perfect style for your plots.