Matplotlib Legend Position
Matplotlib is a popular plotting library in Python that can be used to create various types of visualizations. One important feature of matplotlib is the ability to add a legend to plots, which helps in identifying the different elements in the plot. In this article, we will discuss how to adjust the position of the legend in a matplotlib plot.
Default Legend Position
By default, matplotlib places the legend in the “best” location, which is determined by the algorithm to minimize the overlap with other elements in the plot. Let’s create a simple scatter plot with a legend to demonstrate the default legend position.
import matplotlib.pyplot as plt

x = [1, 2, 3, 4, 5]
y = [2, 3, 5, 7, 11]

plt.scatter(x, y, label='Prime Numbers')
plt.legend()
plt.show()
Output:
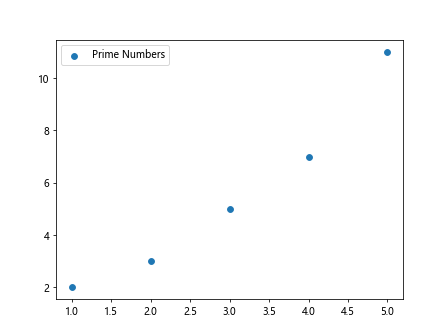
In the above code, we create a scatter plot with prime numbers as data points and add a legend to label them. The legend is placed in the “best” location by default.
Changing Legend Position
If you want to manually control the position of the legend in the plot, you can do so by specifying the loc parameter in the legend() function. The loc parameter accepts a string or a tuple of two numbers that represent the coordinates of the legend.
Here are some common string values that you can use to specify the legend position:
- ‘upper right’
- ‘upper left’
- ‘lower left’
- ‘lower right’
- ‘right’
- ‘center left’
- ‘center right’
- ‘lower center’
- ‘upper center’
- ‘center’
Let’s create a scatter plot and change the legend position to ‘upper left’.
import matplotlib.pyplot as plt

x = [1, 2, 3, 4, 5]
y = [2, 3, 5, 7, 11]

plt.scatter(x, y, label='Prime Numbers')
plt.legend(loc='upper left')
plt.show()
Output:
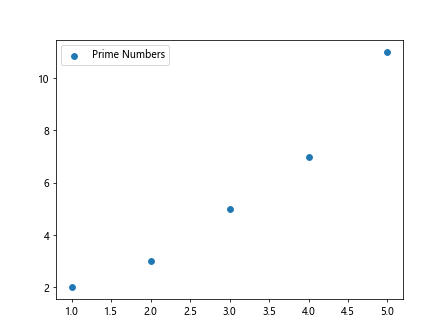
In the above code, we specify the loc parameter as ‘upper left’ to move the legend to the upper left corner of the plot.
Custom Legend Position
If you want more control over the legend position, you can specify the exact coordinates where the legend should be placed using a tuple of two numbers. The numbers represent the normalized coordinates in the figure, ranging from 0 to 1.
For example, to position the legend at the coordinates (0.5, 0.5) in the figure:
import matplotlib.pyplot as plt

x = [1, 2, 3, 4, 5]
y = [2, 3, 5, 7, 11]

plt.scatter(x, y, label='Prime Numbers')
plt.legend(loc=(0.5, 0.5))
plt.show()
Output:
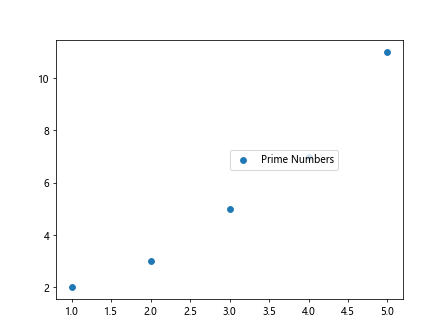
In the above code, we specify the loc parameter as a tuple of (0.5, 0.5) to move the legend to the center of the plot.
Outside Legend
Sometimes, you may want to place the legend outside the plot area to prevent overlapping with the data points. You can achieve this by setting the bbox_to_anchor parameter in the legend() function.
Here is an example of placing the legend outside the plot area to the right:
import matplotlib.pyplot as plt

x = [1, 2, 3, 4, 5]
y = [2, 3, 5, 7, 11]

plt.scatter(x, y, label='Prime Numbers')
plt.legend(loc='upper left', bbox_to_anchor=(1, 1))
plt.show()
Output:
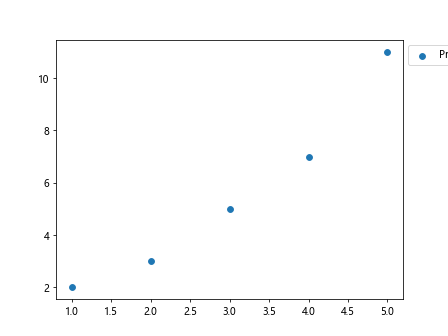
In the above code, we set the bbox_to_anchor parameter to (1, 1) to move the legend outside the plot area to the upper right corner.
Multiple Legends
In some cases, you may have multiple legends in a plot to represent different elements. You can add multiple legends by creating separate legend instances and specifying the loc parameter for each legend.
Let’s create a plot with two legends for prime numbers and Fibonacci numbers:
import matplotlib.pyplot as plt

x = [1, 2, 3, 4, 5]
y = [2, 3, 5, 7, 11]

plt.scatter(x, y, label='Prime Numbers')
plt.scatter(x, [1, 1, 2, 3, 5], label='Fibonacci Numbers')
plt.legend(loc='upper left')
plt.legend(loc='lower right')
plt.show()
Output:
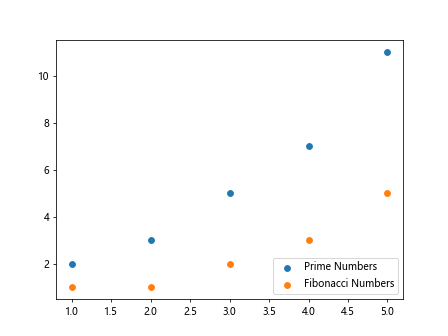
In the above code, we create two separate legend instances for prime numbers and Fibonacci numbers and specify different loc parameters for each legend.
Legend Title
You can add a title to the legend to provide additional information about the plotted elements. To add a title to the legend, you can use the title parameter in the legend() function.
Let’s add a title to the legend for prime numbers:
import matplotlib.pyplot as plt

x = [1, 2, 3, 4, 5]
y = [2, 3, 5, 7, 11]

plt.scatter(x, y, label='Prime Numbers')
plt.legend(title='Numbers', loc='upper left')
plt.show()
Output:
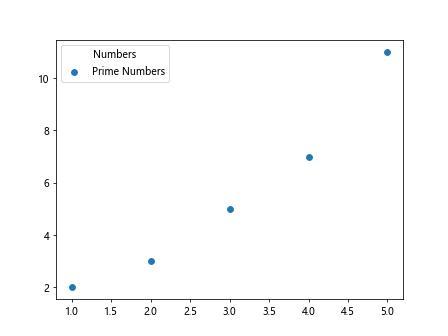
In the above code, we set the title parameter to ‘Numbers’ to add a title to the legend.
Legend Border
If you want to change the border properties of the legend, such as the color, linewidth, or transparency, you can use the edgecolor, linewidth, and alpha parameters in the legend() function.
Here is an example of changing the border color to red and increasing the linewidth:
import matplotlib.pyplot as plt

x = [1, 2, 3, 4, 5]
y = [2, 3, 5, 7, 11]

plt.scatter(x, y, label='Prime Numbers')
plt.legend(edgecolor='red', linewidth=2, loc='upper left')
plt.show()
In the above code, we set the edgecolor parameter to ‘red’ and linewidth to 2 to change the border color and width of the legend.
Legend Background
You can also customize the background properties of the legend, such as the color, transparency, or border, using the facecolor, alpha, and frameon parameters in the legend() function.
Let’s change the background color of the legend to light gray and remove the border:
import matplotlib.pyplot as plt

x = [1, 2, 3, 4, 5]
y = [2, 3, 5, 7, 11]

plt.scatter(x, y, label='Prime Numbers')
plt.legend(facecolor='lightgray', frameon=False, loc='upper left')
plt.show()
Output:
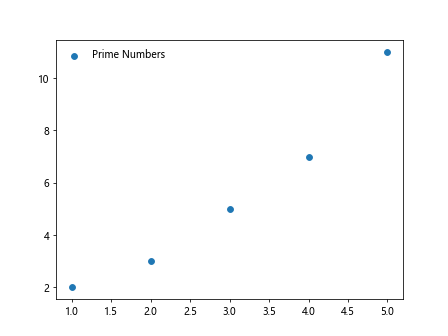
In the above code, we set the facecolor parameter to ‘lightgray’ and frameon to False to change the background color and remove the border of the legend.
Multiple Subplots with Legends
When creating multiple subplots in a figure, you may want to add separate legends for each subplot. You can achieve this by creating separate legend instances for each subplot and specifying the loc parameter for each legend.
Here is an example of creating two subplots with legends:
import matplotlib.pyplot as plt

x = [1, 2, 3, 4, 5]
y = [2, 3, 5, 7, 11]

fig, axs = plt.subplots(2)

axs[0].scatter(x, y, label='Prime Numbers')
axs[0].legend(loc='upper left')

axs[1].scatter(x, [1, 1, 2, 3, 5], label='Fibonacci Numbers')
axs[1].legend(loc='lower right')

plt.show()
Output:
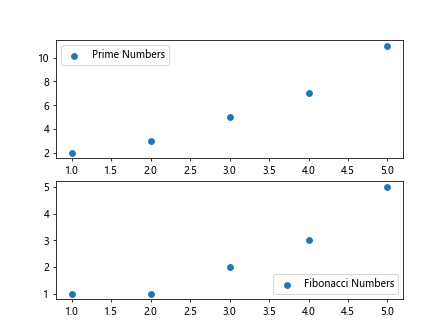
In the above code, we create two subplots and add separate legends to each subplot by specifying the loc parameter for each legend.
Conclusion
In this article, we discussed how to adjust the position of the legend in a matplotlib plot. We covered the default legend position, changing the legend position using string values and normalized coordinates, placing the legend outside the plot area, adding multiple legends, customizing the legend title, border, and background, and creating multiple subplots with legends. By applying these techniques, you can effectively control the position and appearance of legends in your matplotlib plots.