Plotting Legends Outside the Matplotlib Figure
Matplotlib is a powerful visualization library in Python that allows users to create various types of plots, including line plots, bar charts, scatter plots, and more. One common feature in matplotlib plots is the legend, which provides information about the data being visualized. By default, the legend is placed inside the plot area. However, in some cases, you may want to place the legend outside the figure to avoid cluttering the plot. In this article, we will explore how to customize the location of the legend in matplotlib plots.
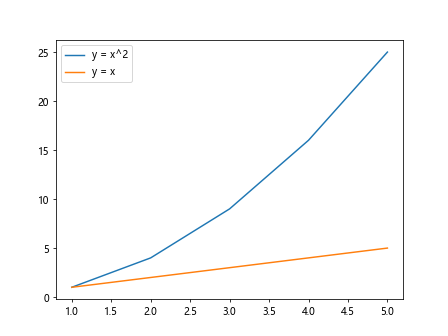
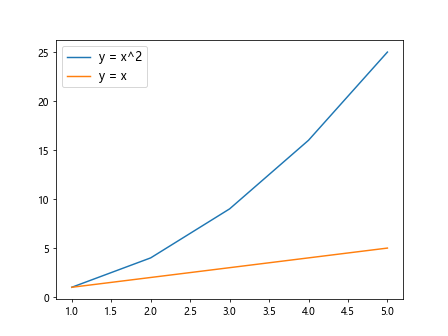
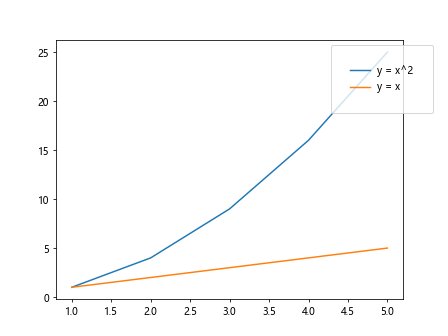
Example 1: Creating a Simple Line Plot with Legend
import matplotlib.pyplot as plt

x = [1, 2, 3, 4, 5]
y1 = [1, 4, 9, 16, 25]
y2 = [1, 2, 3, 4, 5]

plt.plot(x, y1, label='y = x^2')
plt.plot(x, y2, label='y = x')

plt.legend()
plt.show()
Output:
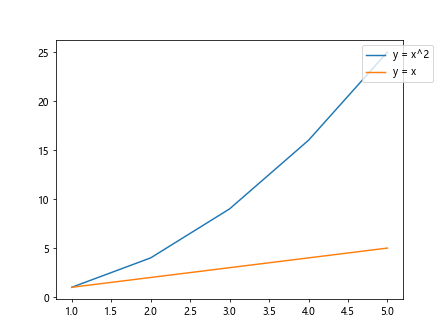
Example 2: Placing the Legend Outside the Upper Right Corner
import matplotlib.pyplot as plt

x = [1, 2, 3, 4, 5]
y1 = [1, 4, 9, 16, 25]
y2 = [1, 2, 3, 4, 5]

plt.plot(x, y1, label='y = x^2')
plt.plot(x, y2, label='y = x')

plt.legend(loc='upper right', bbox_to_anchor=(1.1, 1))
plt.show()
Output:
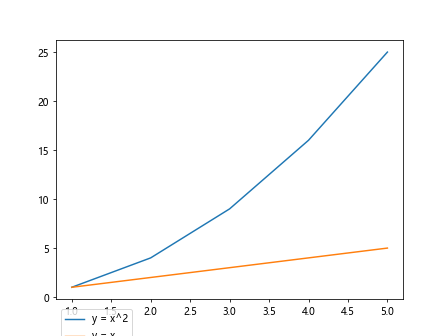
Example 3: Placing the Legend Outside the Lower Left Corner
import matplotlib.pyplot as plt

x = [1, 2, 3, 4, 5]
y1 = [1, 4, 9, 16, 25]
y2 = [1, 2, 3, 4, 5]

plt.plot(x, y1, label='y = x^2')
plt.plot(x, y2, label='y = x')

plt.legend(loc='lower left', bbox_to_anchor=(0, -0.2))
plt.show()
Output:
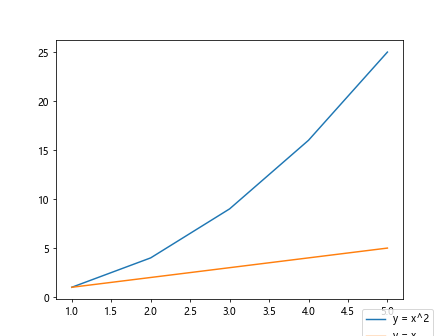
Example 4: Placing the Legend Outside the Lower Right Corner
import matplotlib.pyplot as plt

x = [1, 2, 3, 4, 5]
y1 = [1, 4, 9, 16, 25]
y2 = [1, 2, 3, 4, 5]

plt.plot(x, y1, label='y = x^2')
plt.plot(x, y2, label='y = x')

plt.legend(loc='lower right', bbox_to_anchor=(1.1, -0.2))
plt.show()
Output:
Example 5: Placing the Legend Outside the Upper Left Corner
import matplotlib.pyplot as plt

x = [1, 2, 3, 4, 5]
y1 = [1, 4, 9, 16, 25]
y2 = [1, 2, 3, 4, 5]

plt.plot(x, y1, label='y = x^2')
plt.plot(x, y2, label='y = x')

plt.legend(loc='upper left', bbox_to_anchor=(0, 1))
plt.show()
Output:

Example 6: Adjusting the Legend Font Size
import matplotlib.pyplot as plt

x = [1, 2, 3, 4, 5]
y1 = [1, 4, 9, 16, 25]
y2 = [1, 2, 3, 4, 5]

plt.plot(x, y1, label='y = x^2')
plt.plot(x, y2, label='y = x')

plt.legend(fontsize='large')
plt.show()
Output:
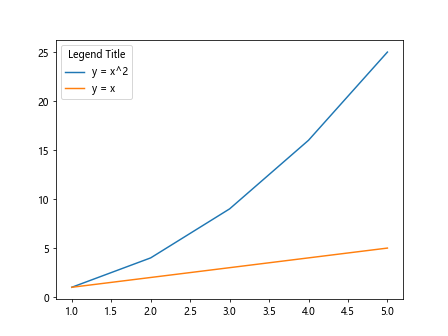
Example 7: Adding a Title to the Legend
import matplotlib.pyplot as plt

x = [1, 2, 3, 4, 5]
y1 = [1, 4, 9, 16, 25]
y2 = [1, 2, 3, 4, 5]

plt.plot(x, y1, label='y = x^2')
plt.plot(x, y2, label='y = x')

plt.legend(title='Legend Title')
plt.show()
Output:
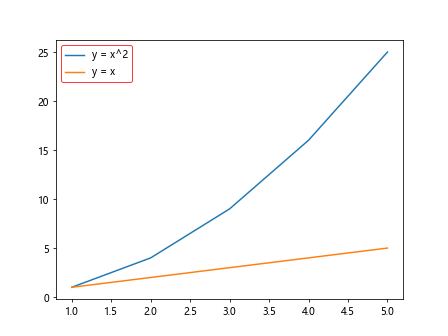
Example 8: Changing the Legend Box Border
import matplotlib.pyplot as plt

x = [1, 2, 3, 4, 5]
y1 = [1, 4, 9, 16, 25]
y2 = [1, 2, 3, 4, 5]

plt.plot(x, y1, label='y = x^2')
plt.plot(x, y2, label='y = x')

plt.legend(edgecolor='red')
plt.show()
Output:
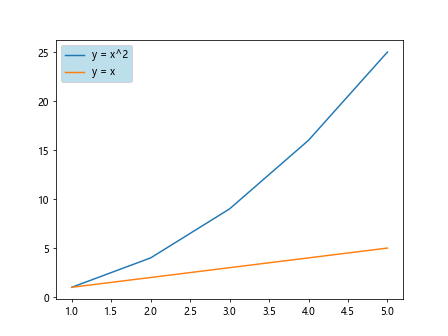
Example 9: Changing the Background Color of the Legend
import matplotlib.pyplot as plt

x = [1, 2, 3, 4, 5]
y1 = [1, 4, 9, 16, 25]
y2 = [1, 2, 3, 4, 5]

plt.plot(x, y1, label='y = x^2')
plt.plot(x, y2, label='y = x')

plt.legend(facecolor='lightblue')
plt.show()
Output:
Example 10: Customizing the Legend Position with Custom Padding
import matplotlib.pyplot as plt

x = [1, 2, 3, 4, 5]
y1 = [1, 4, 9, 16, 25]
y2 = [1, 2, 3, 4, 5]

plt.plot(x, y1, label='y = x^2')
plt.plot(x, y2, label='y = x')

plt.legend(loc='upper right', bbox_to_anchor=(1.1, 1), borderpad=2)
plt.show()
Output:
Conclusion
In this article, we have explored how to customize the location of the legend in matplotlib plots. By adjusting the loc and bbox_to_anchor parameters in the plt.legend() function, you can easily place the legend outside the figure and customize its appearance. Additionally, we have shown how to modify the font size, title, border color, background color, and padding of the legend. These customization options allow you to create visually appealing plots with informative legends in matplotlib.