Matplotlib Legend Locations
When creating plots using Matplotlib, adding a legend to your plot can help viewers understand the meaning of each curve or data point. The location of the legend in your plot is crucial for ensuring it does not obstruct any important information. In this article, we will explore different legend locations in Matplotlib and how to customize their appearance.
Default Legend Location
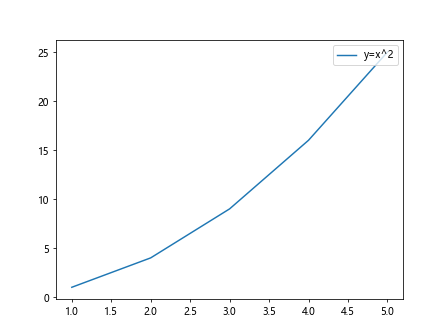
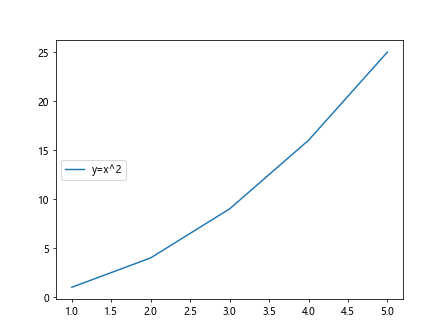
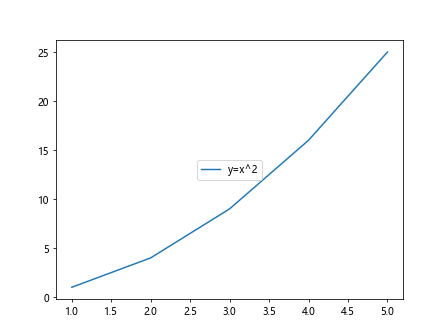
By default, Matplotlib will try to place the legend in the “best” location that does not overlap with the plot itself. Let’s see an example of this:
import matplotlib.pyplot as plt

x = [1, 2, 3, 4, 5]
y = [1, 4, 9, 16, 25]

plt.plot(x, y, label='y=x^2')
plt.legend()

plt.show()
Output:

In this example, the legend is placed in the top right corner of the plot because it does not overlap with the plotted line.
Customizing Legend Location
If you want to manually control the location of the legend, you can do so by specifying the loc parameter in the plt.legend() function. The loc parameter takes a string or integer value that determines the location of the legend.
The string values that you can use for loc include:
- ‘best’
- ‘upper right’
- ‘upper left’
- ‘lower left’
- ‘lower right’
- ‘right’
- ‘center left’
- ‘center right’
- ‘lower center’
- ‘upper center’
- ‘center’
Let’s see examples of how to customize the legend location using these string values:
import matplotlib.pyplot as plt

x = [1, 2, 3, 4, 5]
y = [1, 4, 9, 16, 25]

plt.plot(x, y, label='y=x^2')
plt.legend(loc='upper right')
plt.show()
Output:
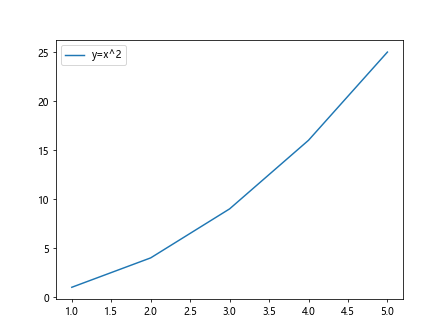
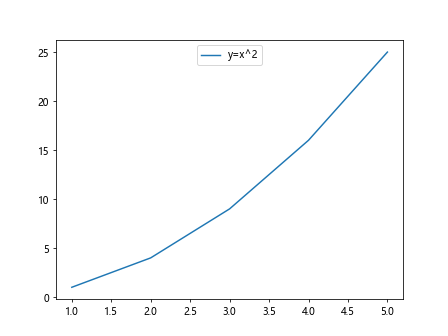
import matplotlib.pyplot as plt

x = [1, 2, 3, 4, 5]
y = [1, 4, 9, 16, 25]

plt.plot(x, y, label='y=x^2')
plt.legend(loc='upper left')
plt.show()
Output:
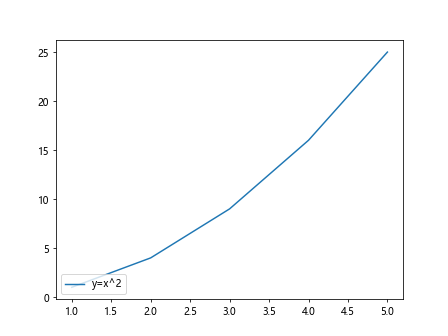
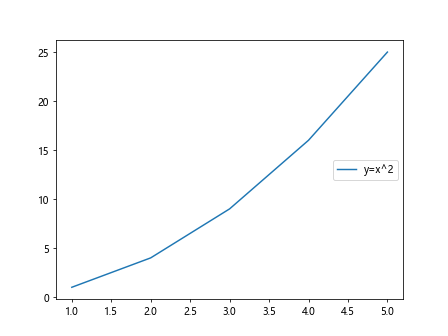
import matplotlib.pyplot as plt

x = [1, 2, 3, 4, 5]
y = [1, 4, 9, 16, 25]

plt.plot(x, y, label='y=x^2')
plt.legend(loc='lower left')
plt.show()
Output:
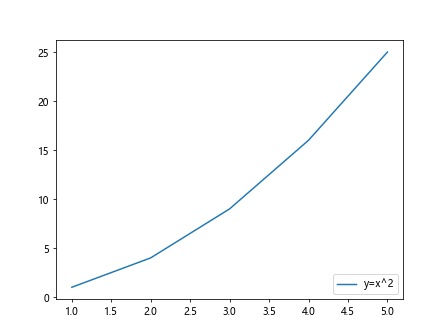
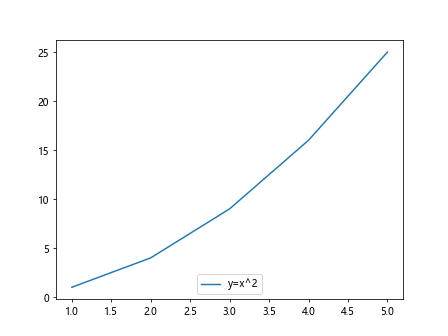
import matplotlib.pyplot as plt

x = [1, 2, 3, 4, 5]
y = [1, 4, 9, 16, 25]

plt.plot(x, y, label='y=x^2')
plt.legend(loc='lower right')
plt.show()
Output:
import matplotlib.pyplot as plt

x = [1, 2, 3, 4, 5]
y = [1, 4, 9, 16, 25]

plt.plot(x, y, label='y=x^2')
plt.legend(loc='right')
plt.show()
Output:

import matplotlib.pyplot as plt

x = [1, 2, 3, 4, 5]
y = [1, 4, 9, 16, 25]

plt.plot(x, y, label='y=x^2')
plt.legend(loc='center left')
plt.show()
Output:
import matplotlib.pyplot as plt

x = [1, 2, 3, 4, 5]
y = [1, 4, 9, 16, 25]

plt.plot(x, y, label='y=x^2')
plt.legend(loc='center right')
plt.show()
Output:
import matplotlib.pyplot as plt

x = [1, 2, 3, 4, 5]
y = [1, 4, 9, 16, 25]

plt.plot(x, y, label='y=x^2')
plt.legend(loc='lower center')
plt.show()
Output:
import matplotlib.pyplot as plt

x = [1, 2, 3, 4, 5]
y = [1, 4, 9, 16, 25]

plt.plot(x, y, label='y=x^2')
plt.legend(loc='upper center')
plt.show()
Output:
import matplotlib.pyplot as plt

x = [1, 2, 3, 4, 5]
y = [1, 4, 9, 16, 25]

plt.plot(x, y, label='y=x^2')
plt.legend(loc='center')
plt.show()
Output:
Custom Legend Position with Coordinates
In addition to using the predefined string values for legend location, you can also specify the exact position of the legend using a tuple of coordinates. The coordinates represent the relative position of the legend within the plot, where (0,0) is the lower left corner and (1,1) is the upper right corner.
Let’s see an example of how to specify a custom legend position using coordinates:
import matplotlib.pyplot as plt

x = [1, 2, 3, 4, 5]
y = [1, 4, 9, 16, 25]

plt.plot(x, y, label='y=x^2')
plt.legend(loc=(0.5, 0.5))
plt.show()
Output:
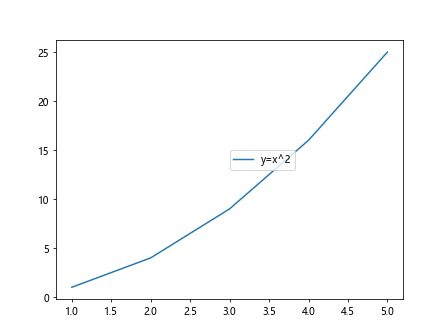
In this example, the legend will be placed at the center of the plot, as the coordinates (0.5, 0.5) represent the center point.
Outside the Axes
Sometimes you may want to place the legend outside the axes of the plot to avoid overlapping with the plotted data. This can be done by setting the bbox_to_anchor parameter in the plt.legend() function. The bbox_to_anchor parameter takes a tuple of coordinates that determine the position of the legend relative to the axes.
Let’s see an example of how to place the legend outside the axes:
import matplotlib.pyplot as plt

x = [1, 2, 3, 4, 5]
y = [1, 4, 9, 16, 25]

plt.plot(x, y, label='y=x^2')
plt.legend(loc='upper left', bbox_to_anchor=(1, 1))
plt.show()
Output:
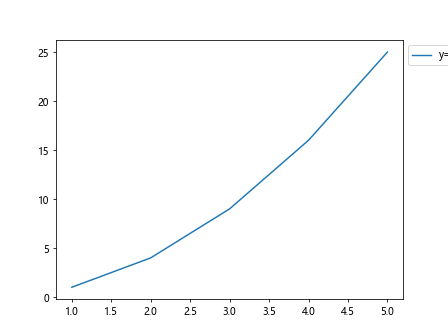
In this example, the legend will be placed in the upper left corner of the plot, but outside the axes.
Legend Title
You can also add a title to the legend to provide more context to the information being displayed. This can be done by using the title parameter in the plt.legend() function.
import matplotlib.pyplot as plt

x = [1, 2, 3, 4, 5]
y = [1, 4, 9, 16, 25]

plt.plot(x, y, label='y=x^2')
plt.legend(title='Curve')
plt.show()
Output:
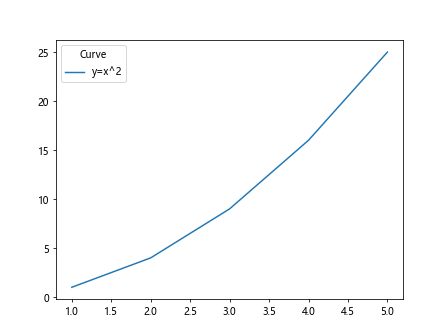
In this example, the legend will have a title “Curve” displayed above the legend entries.
Conclusion
In this article, we have explored different ways to customize the legend location in Matplotlib plots. By understanding how to control the legend position and appearance, you can create more informative and visually appealing plots for your data visualizations. Experiment with the examples provided to find the best legend location for your specific plot.