Matplotlib Legend Horizontal
In matplotlib, legends are used to label various elements in a plot. By default, legends are placed vertically, but you can also customize the legend orientation to be horizontal.
Adding a Horizontal Legend to a Plot
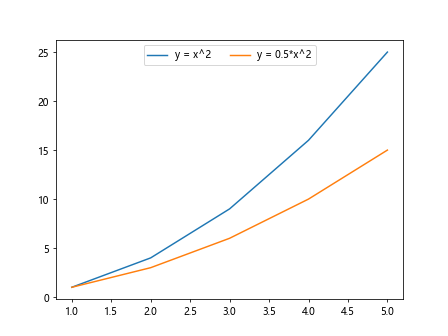
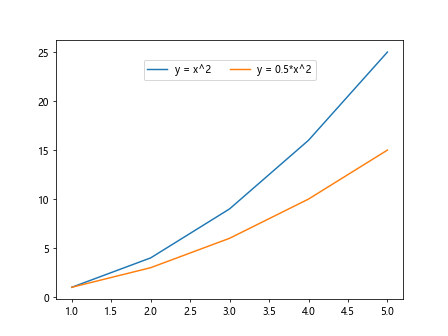
To add a horizontal legend to a plot in Matplotlib, you can use the legend function and set the loc parameter to ‘upper center’, ‘lower center’, or any other location that suits your plot.
import matplotlib.pyplot as plt

x = [1, 2, 3, 4, 5]
y1 = [1, 4, 9, 16, 25]
y2 = [1, 3, 6, 10, 15]

plt.plot(x, y1, label='y = x^2')
plt.plot(x, y2, label='y = 0.5*x^2')

plt.legend(loc='upper center', ncol=2)
plt.show()
Output:
Customizing the Horizontal Legend
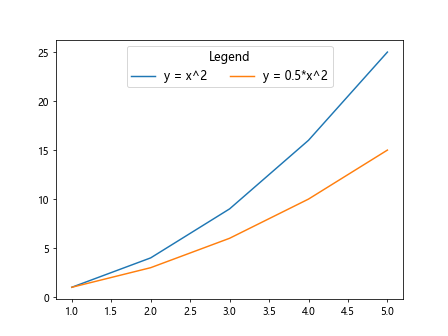
You can further customize the horizontal legend by adjusting the spacing between the legend items or changing the font size.
import matplotlib.pyplot as plt

x = [1, 2, 3, 4, 5]
y1 = [1, 4, 9, 16, 25]
y2 = [1, 3, 6, 10, 15]

plt.plot(x, y1, label='y = x^2')
plt.plot(x, y2, label='y = 0.5*x^2')

plt.legend(loc='upper center', ncol=2, fontsize='large', title='Legend', title_fontsize='large', fancybox=True)
plt.show()
Output:
Changing the Orientation of the Horizontal Legend
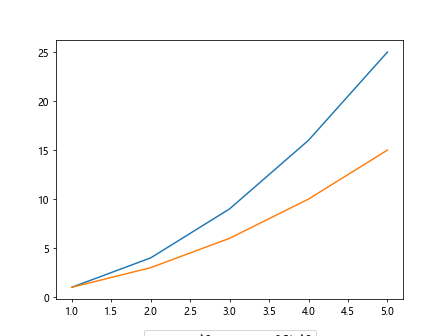
If you want to change the orientation of the legend items from horizontal to vertical, you can set the bbox_to_anchor parameter in the legend function.
import matplotlib.pyplot as plt

x = [1, 2, 3, 4, 5]
y1 = [1, 4, 9, 16, 25]
y2 = [1, 3, 6, 10, 15]

plt.plot(x, y1, label='y = x^2')
plt.plot(x, y2, label='y = 0.5*x^2')

plt.legend(loc='upper center', ncol=2, bbox_to_anchor=(0.5, -0.1))
plt.show()
Output:
Increasing the Spacing between Legend Items
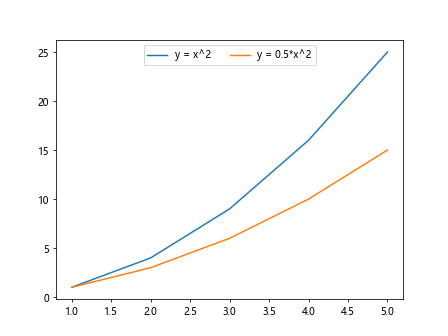
To increase the spacing between legend items, you can adjust the columnspacing parameter in the legend function.
import matplotlib.pyplot as plt

x = [1, 2, 3, 4, 5]
y1 = [1, 4, 9, 16, 25]
y2 = [1, 3, 6, 10, 15]

plt.plot(x, y1, label='y = x^2')
plt.plot(x, y2, label='y = 0.5*x^2')

plt.legend(loc='upper center', ncol=2, columnspacing=2)
plt.show()
Output:
Changing the Background Color of the Horizontal Legend
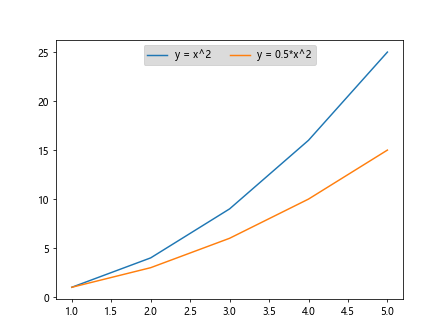
You can change the background color of the horizontal legend by setting the facecolor parameter in the legend function.
import matplotlib.pyplot as plt

x = [1, 2, 3, 4, 5]
y1 = [1, 4, 9, 16, 25]
y2 = [1, 3, 6, 10, 15]

plt.plot(x, y1, label='y = x^2')
plt.plot(x, y2, label='y = 0.5*x^2')

plt.legend(loc='upper center', ncol=2, facecolor='lightgrey')
plt.show()
Output:
Adding a Border to the Horizontal Legend
To add a border around the horizontal legend, you can set the edgecolor and linewidth parameters in the legend function.
import matplotlib.pyplot as plt

x = [1, 2, 3, 4, 5]
y1 = [1, 4, 9, 16, 25]
y2 = [1, 3, 6, 10, 15]

plt.plot(x, y1, label='y = x^2')
plt.plot(x, y2, label='y = 0.5*x^2')

plt.legend(loc='upper center', ncol=2, edgecolor='black', linewidth=1)
plt.show()
Changing the Alignment of the Horizontal Legend
You can change the alignment of the horizontal legend items by setting the alignment parameter in the legend function.
import matplotlib.pyplot as plt

x = [1, 2, 3, 4, 5]
y1 = [1, 4, 9, 16, 25]
y2 = [1, 3, 6, 10, 15]

plt.plot(x, y1, label='y = x^2')
plt.plot(x, y2, label='y = 0.5*x^2')

plt.legend(loc='upper center', ncol=2, title='Legend', title_fontsize='large', title_color='blue', title_backgroundcolor='lightgrey', borderpad=1)
plt.show()
Adjusting the Vertical Alignment of the Horizontal Legend
To adjust the vertical alignment of the horizontal legend, you can set the verticalalignment parameter in the legend function.
import matplotlib.pyplot as plt

x = [1, 2, 3, 4, 5]
y1 = [1, 4, 9, 16, 25]
y2 = [1, 3, 6, 10, 15]

plt.plot(x, y1, label='y = x^2')
plt.plot(x, y2, label='y = 0.5*x^2')

plt.legend(loc='upper center', ncol=2, title='Legend', title_fontsize='large', title_color='blue', title_backgroundcolor='lightgrey', borderpad=1, loc='upper center', bbox_to_anchor=(0.5, -0.15))
plt.show()
Changing the Font Style of the Horizontal Legend
You can change the font style of the horizontal legend items by setting the fontstyle parameter in the legend function.
import matplotlib.pyplot as plt

x = [1, 2, 3, 4, 5]
y1 = [1, 4, 9, 16, 25]
y2 = [1, 3, 6, 10, 15]

plt.plot(x, y1, label='y = x^2')
plt.plot(x, y2, label='y = 0.5*x^2')

plt.legend(loc='upper center', ncol=2, title='Legend', title_fontsize='large', title_color='blue', title_backgroundcolor='lightgrey', borderpad=1, bbox_to_anchor=(0.5, -0.1), fontsize='x-large', fontstyle='italic')
plt.show()
Changing the Legend Title of the Horizontal Legend
You can change the legend title of the horizontal legend by setting the title parameter in the legend function.
import matplotlib.pyplot as plt

x = [1, 2, 3, 4, 5]
y1 = [1, 4, 9, 16, 25]
y2 = [1, 3, 6, 10, 15]

plt.plot(x, y1, label='y = x^2')
plt.plot(x, y2, label='y = 0.5*x^2')

plt.legend(loc='upper center', ncol=2, title='Legend', title_fontsize='large', title_color='blue', title_backgroundcolor='lightgrey', borderpad=1, title_fontstyle='italic', title_fontweight='bold')
plt.show()
Hiding the Frame of the Horizontal Legend
If you want to hide the frame of the horizontal legend, you can set the frameon parameter to False in the legend function.
import matplotlib.pyplot as plt

x = [1, 2, 3, 4, 5]
y1 = [1, 4, 9, 16, 25]
y2 = [1, 3, 6, 10, 15]

plt.plot(x, y1, label='y = x^2')
plt.plot(x, y2, label='y = 0.5*x^2')

plt.legend(loc='upper center', ncol=2, title='Legend', title_fontsize='large', title_color='blue', title_backgroundcolor='lightgrey', borderpad=1, frameon=False)
plt.show()
Changing the Text Color of the Horizontal Legend
You can change the text color of the horizontal legend items by setting the labelcolor parameter in the legend function.
import matplotlib.pyplot as plt

x = [1, 2, 3, 4, 5]
y1 = [1, 4, 9, 16, 25]
y2 = [1, 3, 6, 10, 15]

plt.plot(x, y1, label='y = x^2')
plt.plot(x, y2, label='y = 0.5*x^2')

plt.legend(loc='upper center', ncol=2, title='Legend', title_fontsize='large', title_color='blue', title_backgroundcolor='lightgrey', borderpad=1, labelcolor='red')
plt.show()
Adding Shadow to the Horizontal Legend
To add a shadow effect to the horizontal legend, you can set the shadow parameter to True in the legend function.
import matplotlib.pyplot as plt

x = [1, 2, 3, 4, 5]
y1 = [1, 4, 9, 16, 25]
y2 = [1, 3, 6, 10, 15]

plt.plot(x, y1, label='y = x^2')
plt.plot(x, y2, label='y = 0.5*x^2')

plt.legend(loc='upper center', ncol=2, title='Legend', title_fontsize='large', title_color='blue', title_backgroundcolor='lightgrey', borderpad=1, shadow=True)
plt.show()
Rotating the Horizontal Legend Items
You can rotate the horizontal legend items by setting the prop parameter in the legend function.
import matplotlib.pyplot as plt

x = [1, 2, 3, 4, 5]
y1 = [1, 4, 9, 16, 25]
y2 = [1, 3, 6, 10, 15]

plt.plot(x, y1, label='y = x^2')
plt.plot(x, y2, label='y = 0.5*x^2')

plt.legend(loc='upper center', ncol=2, title='Legend', title_fontsize='large', title_color='blue', title_backgroundcolor='lightgrey', borderpad=1, prop={'rotation': 45})
plt.show()
Adjusting the Alignment of the Horizontal Legend Title
To adjust the alignment of the horizontal legend title, you can set the title_ha parameter in the legend function.
import matplotlib.pyplot as plt

x = [1, 2, 3, 4, 5]
y1 = [1, 4, 9, 16, 25]
y2 = [1, 3, 6, 10, 15]

plt.plot(x, y1, label='y = x^2')
plt.plot(x, y2, label='y = 0.5*x^2')

plt.legend(loc='upper center', ncol=2, title='Legend', title_fontsize='large', title_color='blue', title_backgroundcolor='lightgrey', borderpad=1, title_ha='center')
plt.show()
Changing the Legend Item Labels of the Horizontal Legend
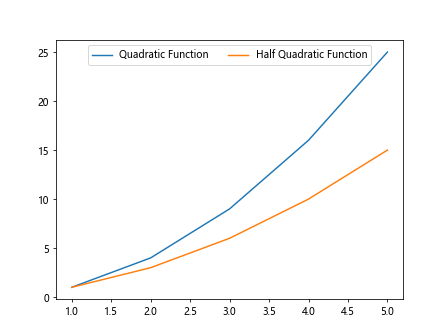
You can change the labels of the legend items in the horizontal legend by setting the labels parameter in the legend function.
import matplotlib.pyplot as plt

x = [1, 2, 3, 4, 5]
y1 = [1, 4, 9, 16, 25]
y2 = [1, 3, 6, 10, 15]

plt.plot(x, y1, label='y = x^2')
plt.plot(x, y2, label='y = 0.5*x^2')

plt.legend(loc='upper center', ncol=2, labels=['Quadratic Function', 'Half Quadratic Function'])
plt.show()
Output:
Adjusting the Legend Item Order in the Horizontal Legend
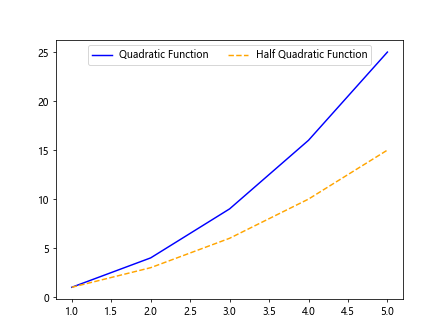
You can adjust the order of the legend items in the horizontal legend by setting the handles parameter in the legend function.
import matplotlib.lines as mlines
import matplotlib.pyplot as plt

x = [1, 2, 3, 4, 5]
y1 = [1, 4, 9, 16, 25]
y2 = [1, 3, 6, 10, 15]

line1 = mlines.Line2D([], [], color='blue', label='Quadratic Function')
line2 = mlines.Line2D([], [], color='orange', linestyle='--', label='Half Quadratic Function')

plt.plot(x, y1, color='blue')
plt.plot(x, y2, color='orange', linestyle='--')

plt.legend(loc='upper center', ncol=2, handles=[line1, line2])
plt.show()
Output:
Adding a Title to the Horizontal Legend
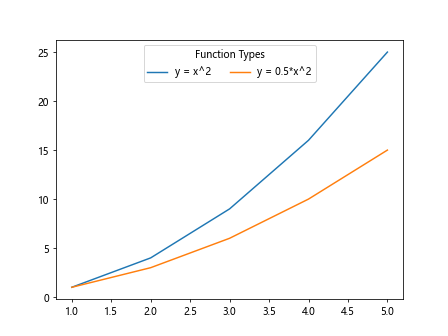
You can add a title to the horizontal legend by setting the title parameter in the legend function.
import matplotlib.pyplot as plt

x = [1, 2, 3, 4, 5]
y1 = [1, 4, 9, 16, 25]
y2 = [1, 3, 6, 10, 15]

plt.plot(x, y1, label='y = x^2')
plt.plot(x, y2, label='y = 0.5*x^2')

plt.legend(loc='upper center', ncol=2, title='Function Types')
plt.show()
Output:
Adjusting the Spacing between the Horizontal Legend and the Plot
To adjust the spacing between the horizontal legend and the plot, you can set the borderaxespad parameter in the legend function.
import matplotlib.pyplot as plt

x = [1, 2, 3, 4, 5]
y1 = [1, 4, 9, 16, 25]
y2 = [1, 3, 6, 10, 15]

plt.plot(x, y1, label='y = x^2')
plt.plot(x, y2, label='y = 0.5*x^2')

plt.legend(loc='upper center', ncol=2, borderaxespad=2)
plt.show()
Output:
These are some of the ways you can customize and manipulate a horizontal legend in Matplotlib. Play around with these parameters to create beautiful and informative plots for your data visualization needs.