matplotlib color scales
Matplotlib is a powerful plotting library in Python that allows users to create a wide range of visualizations. One important aspect of creating visually appealing plots is choosing color scales that effectively represent data. In this article, we will explore different color scales available in Matplotlib and how they can be customized to suit your specific needs.
1. Basic Color Scales
Matplotlib provides a range of basic color maps that can be used for visualizing data. These color maps are included in the matplotlib.cm module. Let’s take a look at some examples:
import matplotlib.pyplot as plt
import numpy as np

x = np.linspace(0, 10, 100)
y = np.sin(x)

plt.scatter(x, y, c=y, cmap='viridis')
plt.colorbar()
plt.show()
Output:
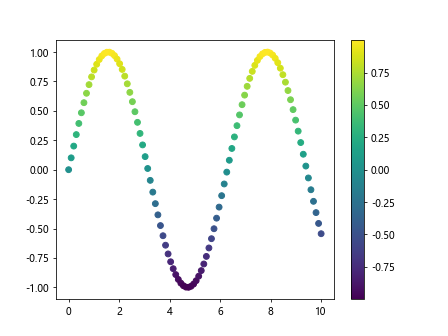
In the example above, we used the viridis color map to represent the y values in a scatter plot. The cmap parameter is used to specify the color map to be used.
2. Customizing Color Scales
Matplotlib allows users to customize color scales by adjusting parameters such as brightness, contrast, and saturation. Let’s see an example of customizing a color map:
import matplotlib.pyplot as plt
import numpy as np

x = np.linspace(0, 10, 100)
y = np.sin(x)

plt.scatter(x, y, c=y, cmap='viridis', vmin=-1, vmax=1)
plt.colorbar()
plt.show()
Output:
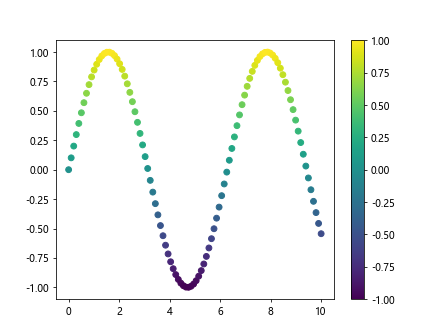
In the example above, we used the vmin and vmax parameters to set the range of colors to be used in the color map. This can help emphasize different aspects of the data being visualized.
3. Sequential Color Scales
Sequential color scales are used when the data being visualized has a natural ordering. These color scales progress from one color to another in a sequential manner. Let’s look at an example:
import matplotlib.pyplot as plt
import numpy as np

x = np.linspace(0, 10, 100)
y = np.sin(x)

plt.scatter(x, y, c=y, cmap='hot')
plt.colorbar()
plt.show()
Output:
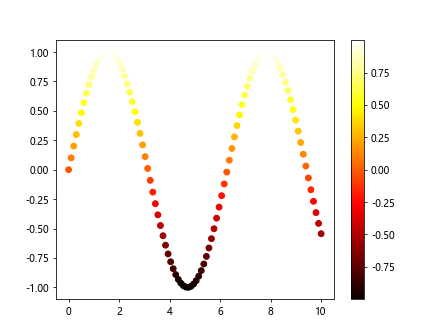
In the example above, we used the hot color map, which progresses from dark colors to bright colors. This can be effective for highlighting trends in the data.
4. Diverging Color Scales
Diverging color scales are useful when visualizing data with a central point or threshold. These color scales progress from two distinct colors and converge at a central color. Let’s see an example:
import matplotlib.pyplot as plt
import numpy as np

x = np.linspace(0, 10, 100)
y = np.sin(x)

plt.scatter(x, y, c=y, cmap='coolwarm')
plt.colorbar()
plt.show()
Output:
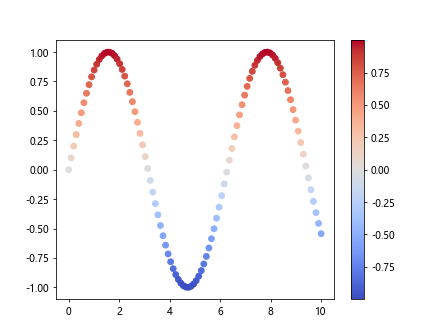
In the example above, we used the coolwarm color map, which progresses from cool colors to warm colors, highlighting the central value of the data being visualized.
5. Qualitative Color Scales
Qualitative color scales are used for categorical data where there is no inherent ordering. These color scales provide distinct colors for each category. Let’s explore an example:
import matplotlib.pyplot as plt
import numpy as np

x = np.linspace(0, 10, 100)
y = np.sin(x) > 0

plt.scatter(x, y, c=y, cmap='tab10')
plt.colorbar()
plt.show()
Output:
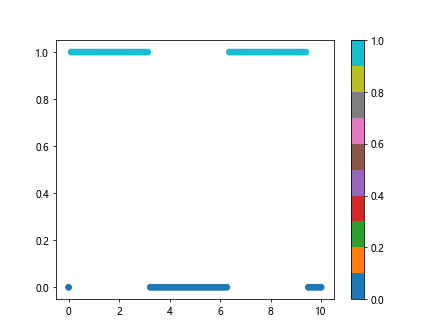
In the example above, we used the tab10 color map, which provides a set of distinct colors for different categories. This can be useful for distinguishing between different groups in the data.
6. Creating Custom Color Maps
Matplotlib also allows users to create custom color maps using the ListedColormap class. This can be useful when you want to define specific colors for different values in the data. Let’s see an example of creating a custom color map:
import matplotlib.pyplot as plt
import numpy as np
from matplotlib.colors import ListedColormap

colors = ['#FF0000', '#00FF00', '#0000FF']  # Red, Green, Blue
cmap_custom = ListedColormap(colors)

x = np.linspace(0, 10, 100)
y = np.random.choice([0, 1, 2], 100)

plt.scatter(x, y, c=y, cmap=cmap_custom)
plt.colorbar()
plt.show()
Output:
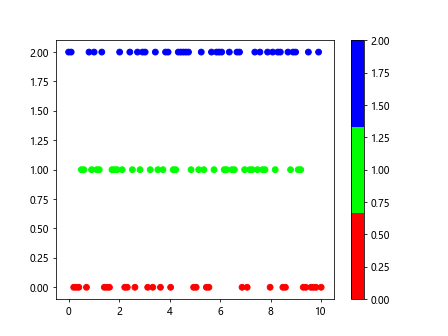
In the example above, we defined a custom color map with red, green, and blue colors. We then used this color map to visualize the randomly generated data points.
7. Creating Interactive Color Maps
Matplotlib also supports interactive color maps through the cmaps() function in the matplotlib.cm module. This function returns a dictionary of all available color maps. Let’s explore an example:
import matplotlib.pyplot as plt
from matplotlib import cm

cmaps = [cm for cm in dir(plt.cm) if not cm.startswith('_')]
print(cmaps)
In the example above, we used the dir() function to list all available color maps in Matplotlib. This can be useful for exploring different color maps and selecting the most appropriate one for your data.
8. Using Colormaps in 3D Plots
Colormaps can also be used in 3D plots to represent the z-values of the data points. Let’s see an example of visualizing 3D data using a color map:
import matplotlib.pyplot as plt
import numpy as np
from mpl_toolkits.mplot3d import Axes3D

x = np.linspace(0, 10, 100)
y = np.sin(x)
z = np.cos(x)

fig = plt.figure()
ax = fig.add_subplot(111, projection='3d')

sc = ax.scatter(x, y, z, c=z, cmap='viridis')
plt.colorbar(sc)
plt.show()
Output:
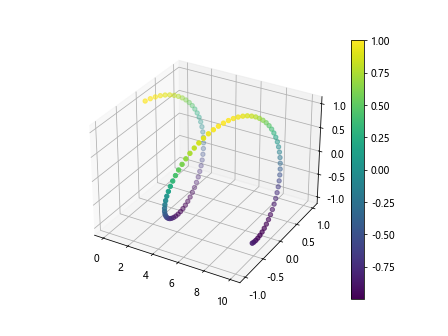
In the example above, we used the viridis color map to represent the z-values in a 3D scatter plot. This can help visualize the data in a more informative way.
9. Combining Multiple Color Scales
Matplotlib also allows users to combine multiple color scales in a single plot. This can be useful for highlighting different aspects of the data being visualized. Let’s see an example:
import matplotlib.pyplot as plt
import numpy as np

x = np.linspace(0, 10, 100)
y = np.sin(x)

plt.scatter(x, y, c=y, cmap='coolwarm')
plt.plot(x, y, color='black')
plt.show()
Output:
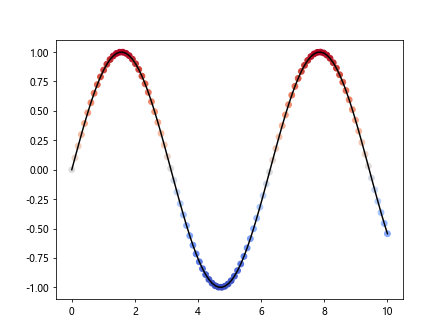
In the example above, we used a diverging color scale for the scatter plot and a black color for the line plot. This combination can help emphasize the central value of the data.
10. Conclusion
In this article, we have explored the various color scales available in Matplotlib and how they can be customized to create visually appealing plots. By understanding the different types of color scales and how they can be used effectively, you can enhance the visual impact of your data visualizations. Experimenting with different color maps and customizing them to suit your specific needs can help you create more informative and engaging plots.