Matplotlib Color Palettes
When creating visualizations using Matplotlib, choosing the right color palette is crucial for conveying the message effectively. Matplotlib provides a variety of color palettes to choose from, allowing you to customize the colors of your plots to suit your specific needs. In this article, we will explore some of the popular color palettes available in Matplotlib and how to use them in your visualizations.
Default Color Cycle
Matplotlib has a default color cycle that is used when plotting multiple lines on the same axes without specifying colors. Let’s take a look at how to access and customize the default color cycle:
import matplotlib.pyplot as plt

# Get the default color cycle
colors = plt.rcParams['axes.prop_cycle'].by_key()['color']
print(colors)

# Customizing the default color cycle
plt.rcParams['axes.prop_cycle'] = plt.cycler(color=['blue', 'orange', 'green', 'red'])
Categorical Color Palettes
Categorical color palettes are useful when visualizing categorical data such as different categories or groups. Matplotlib provides a variety of color palettes that are suitable for categorical data. Here’s an example of using a categorical color palette:
import matplotlib.pyplot as plt

# Using a categorical color palette
colors = plt.cm.tab10.colors
print(colors)
Sequential Color Palettes
Sequential color palettes are ideal for visualizing ordered or continuous data, where one color transitions smoothly to another. Matplotlib offers a range of sequential color palettes to choose from. Let’s see how to use a sequential color palette:
import matplotlib.pyplot as plt

# Using a sequential color palette
colors = plt.cm.Blues(range(10))
print(colors)
Diverging Color Palettes
Diverging color palettes are useful for visualizing data that has a distinct midpoint or threshold. These color palettes typically have two distinct colors on either side of the midpoint. Let’s explore how to use a diverging color palette in Matplotlib:
import matplotlib.pyplot as plt

# Using a diverging color palette
colors = plt.cm.seismic(range(10))
print(colors)
Custom Color Maps
In addition to the predefined color palettes in Matplotlib, you can also create your custom color maps using the ListedColormap class. This allows you to define your unique set of colors for your visualizations. Here’s an example of creating a custom color map:
import matplotlib.pyplot as plt
from matplotlib.colors import ListedColormap

# Create a custom color map
colors = ['blue', 'green', 'yellow', 'red']
cmap = ListedColormap(colors)
print(cmap)
Reversed Color Maps
Sometimes, you may want to reverse the order of colors in a color map to better represent your data. Matplotlib provides a simple way to reverse the colors in a color map. Let’s see how to reverse a color map:
import matplotlib.pyplot as plt

# Reverse a color map
cmap = plt.cm.viridis
cmap_reversed = cmap.reversed()
print(cmap_reversed)
Using Color Maps in Plots
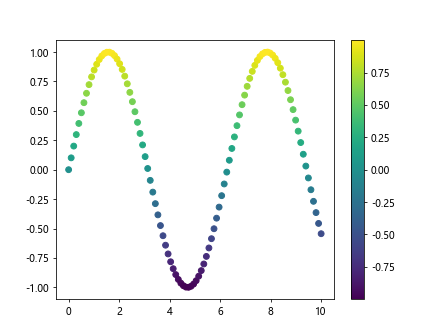
Once you have selected a color palette or created a custom color map, you can easily apply it to your plots using the cmap parameter in plotting functions. Let’s see an example of how to use a color map in a plot:
import matplotlib.pyplot as plt
import numpy as np

# Generate some data
x = np.linspace(0, 10, 100)
y = np.sin(x)

# Plot the data with a color map
plt.scatter(x, y, c=y, cmap='viridis')
plt.colorbar()
plt.show()
Output:
Discrete Color Maps
In some cases, you may want to discretize a continuous color map into a set number of distinct colors. Matplotlib provides the ListedColormap class, which allows you to create a discrete color map from a continuous one. Let’s see how to create a discrete color map:
import matplotlib.pyplot as plt
from matplotlib.colors import ListedColormap

# Create a continuous color map
cmap = plt.cm.viridis

# Create a discrete color map from the continuous one
cmap_discrete = ListedColormap(cmap(np.linspace(0, 1, 5)))
print(cmap_discrete)
Color Map Normalization
When using a color map in a plot, it’s essential to normalize your data to ensure the colors are distributed appropriately. Matplotlib provides various normalization methods to scale your data to the range of the color map. Let’s take a look at how to normalize data for a color map:
import matplotlib.pyplot as plt
import matplotlib.colors as mcolors
import numpy as np

# Generate some data
data = np.random.rand(100)

# Create a normalization instance
norm = mcolors.Normalize(vmin=np.min(data), vmax=np.max(data))

# Normalize the data
data_normalized = norm(data)
print(data_normalized)
Interactive Color Map Selection
Matplotlib also allows you to interactively select color maps using the matplotlib.cm module. This can be useful for exploring different color maps and selecting the one that best fits your visualization. Here’s an example of interactive color map selection:
import matplotlib.pyplot as plt
import matplotlib.cm as cm

# Interactive color map selection
cmaps = [cmap for cmap in cm.datad if not cmap.endswith("_r")]
print(cmaps)
Color Map Comparisons
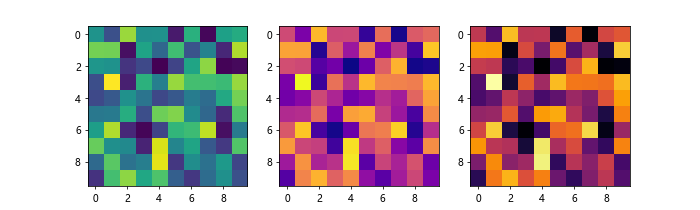
When choosing a color map for your visualization, it’s essential to compare different color maps to see how they represent your data. Matplotlib provides tools to help you compare color maps visually. Let’s see how to compare color maps:
import matplotlib.pyplot as plt
import numpy as np

# Generate some data
data = np.random.rand(10, 10)

# Compare color maps
fig, axs = plt.subplots(1, 3, figsize=(10, 3))
axs[0].imshow(data, cmap='viridis')
axs[1].imshow(data, cmap='plasma')
axs[2].imshow(data, cmap='inferno')
plt.show()
Output:
Conclusion
In this article, we have explored the various color palettes available in Matplotlib and how to use them in your visualizations. By choosing the right color palette, you can enhance the clarity and effectiveness of your plots. Experiment with different color palettes and find the one that best suits your data and storytelling needs. Color is a powerful tool in data visualization, so make sure to use it wisely to convey meaningful insights to your audience.