Using Matplotlib Legend Position Outside
Matplotlib is a powerful library for creating visualizations in Python. One common requirement when creating plots is to place the legend outside the plot area. In this article, we will explore how to position the legend outside the plot area using Matplotlib.
Example 1: Placing the Legend outside the Plot Area
import matplotlib.pyplot as plt

x = [1, 2, 3, 4, 5]
y = [2, 3, 5, 7, 11]

plt.plot(x, y, label='Prime Numbers')
plt.legend(loc='center left', bbox_to_anchor=(1, 0.5))
plt.show()
Output:
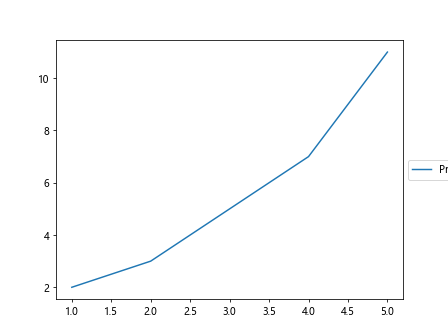
In this example, we are using the bbox_to_anchor argument to specify the position of the legend outside the plot area. The loc parameter is set to 'center left' to place the legend to the top right of the plot.
Example 2: Placing the Legend to the Right of the Plot
import matplotlib.pyplot as plt

x = [1, 2, 3, 4, 5]
y = [3, 6, 9, 12, 15]

plt.plot(x, y, label='Multiples of 3')
plt.legend(loc='center left', bbox_to_anchor=(1, 0.5))
plt.show()
Output:
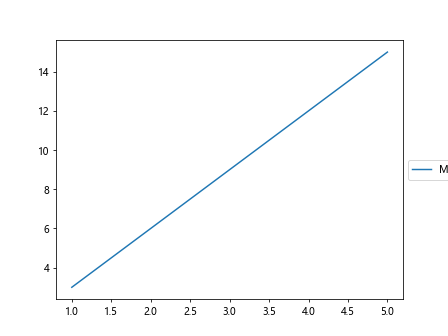
In this example, we are again using the bbox_to_anchor argument to position the legend to the right of the plot area.
Example 3: Placing the Legend below the Plot
import matplotlib.pyplot as plt

x = [1, 2, 3, 4, 5]
y = [1, 4, 9, 16, 25]

plt.plot(x, y, label='Squares of Numbers')
plt.legend(loc='upper center', bbox_to_anchor=(0.5, -0.1))
plt.show()
Output:
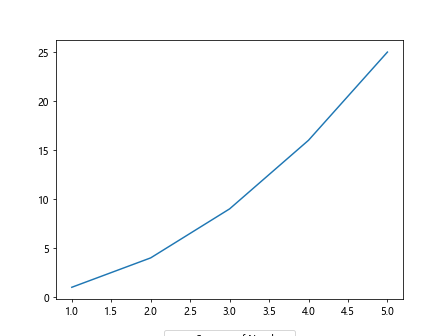
In this example, we are using the bbox_to_anchor argument to place the legend below the plot.
Example 4: Placing the Legend to the Left of the Plot
import matplotlib.pyplot as plt

x = [1, 2, 3, 4, 5]
y = [1, 8, 27, 64, 125]

plt.plot(x, y, label='Cubes of Numbers')
plt.legend(loc='center right', bbox_to_anchor=(-0.1, 0.5))
plt.show()
Output:
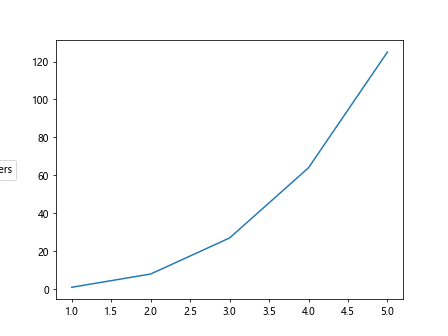
Here, we use the bbox_to_anchor argument to place the legend to the left of the plot area.
Example 5: Adjusting the Legend Position
import matplotlib.pyplot as plt

x = [1, 2, 3, 4, 5]
y = [2, 4, 6, 8, 10]

plt.plot(x, y, label='Even Numbers')
plt.legend(loc='upper right', bbox_to_anchor=(1.15, 1))
plt.show()
Output:
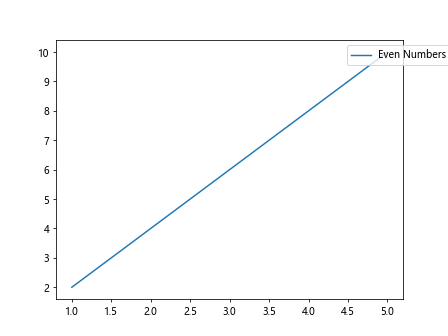
In this example, we are adjusting the legend position using the bbox_to_anchor argument to move the legend slightly outside the plot.
Example 6: Placing Multiple Legends outside the Plot
import matplotlib.pyplot as plt

x = [1, 2, 3, 4, 5]
y1 = [1, 3, 5, 7, 9]
y2 = [2, 4, 6, 8, 10]

plt.plot(x, y1, label='Odd Numbers')
plt.plot(x, y2, label='Even Numbers')
plt.legend(loc='upper center', bbox_to_anchor=(0.5, 1.1))
plt.show()
Output:
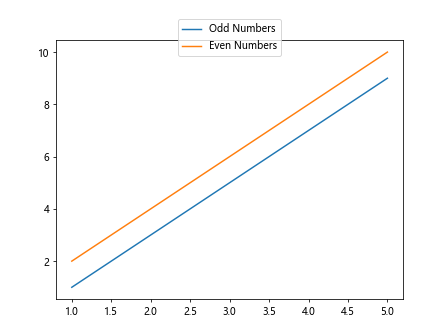
In this example, we are placing two legends outside the plot area by specifying the position with bbox_to_anchor.
Example 7: Using Fancybox for Legend
import matplotlib.pyplot as plt

x = [1, 2, 3, 4, 5]
y = [3, 6, 9, 12, 15]

plt.plot(x, y, label='Multiples of 3')
plt.legend(loc='center left', bbox_to_anchor=(1, 0.5), fancybox=True)
plt.show()
Output:
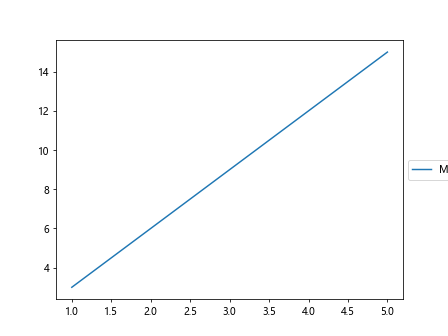
Here, we are using the fancybox=True option to create a fancy box around the legend.
Example 8: Changing the Legend Font Size
import matplotlib.pyplot as plt

x = [1, 2, 3, 4, 5]
y = [2, 4, 6, 8, 10]

plt.plot(x, y, label='Even Numbers')
plt.legend(loc='center left', bbox_to_anchor=(1, 0.5), fontsize='large')
plt.show()
Output:
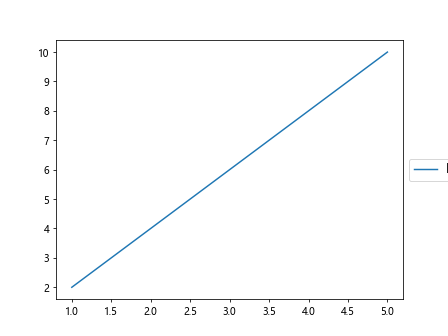
In this example, we are setting the font size of the legend to 'large'.
Example 9: Changing the Legend Title
import matplotlib.pyplot as plt

x = [1, 2, 3, 4, 5]
y = [1, 4, 9, 16, 25]

plt.plot(x, y, label='Squares of Numbers')
plt.legend(title='Number Types', loc='upper center', bbox_to_anchor=(0.5, -0.1))
plt.show()
Output:
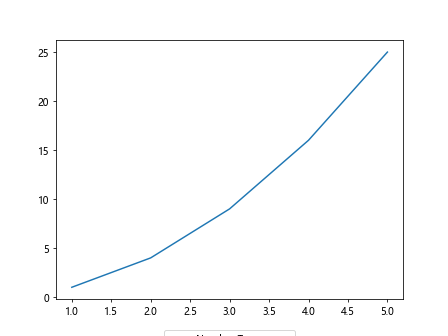
In this example, we are setting the title of the legend to ‘Number Types’.
Example 10: Setting the Legend Background Color
import matplotlib.pyplot as plt

x = [1, 2, 3, 4, 5]
y = [1, 3, 5, 7, 9]

plt.plot(x, y, label='Odd Numbers')
plt.legend(loc='upper right', bbox_to_anchor=(1, 1), facecolor='lightgrey')
plt.show()
Output:
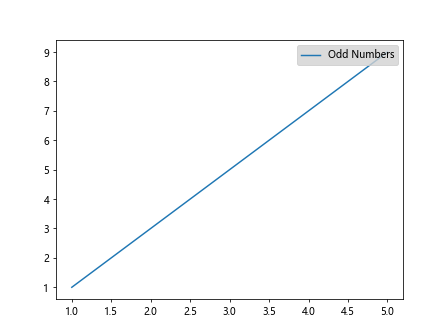
Here, we are setting the background color of the legend to ‘lightgrey’.
Conclusion
In this article, we have explored how to position the legend outside the plot area in Matplotlib. By using the bbox_to_anchor argument along with the loc parameter, we can customize the location of the legend to suit our needs. Additionally, we have seen how to adjust the legend position, use multiple legends, create a fancybox, change the font size and title, and set the background color of the legend. With these techniques, you can create visually appealing plots with legends that are positioned exactly where you want them.