Matplotlib Linear Fit
Matplotlib is a popular Python library for data visualization. One common task in data analysis is fitting a linear regression line to a set of data points. Matplotlib provides a simple way to plot this linear fit using the plot function. In this article, we will explore how to perform linear fit using Matplotlib.
Simple Linear Fit
import numpy as np
import matplotlib.pyplot as plt

# Generate some random data
x = np.array([1, 2, 3, 4, 5])
y = np.array([2, 4, 6, 8, 10])

# Fit a linear regression line
slope, intercept = np.polyfit(x, y, 1)
fit_line = slope * x + intercept

# Plot the original data and the linear fit
plt.scatter(x, y)
plt.plot(x, fit_line, color='red')
plt.show()
Output:
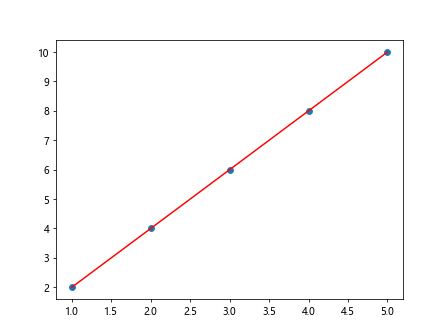
In the above code, we first generate some random data points x and y. We then use NumPy’s polyfit function to calculate the slope and intercept of the linear regression line. Finally, we plot the original data points as a scatter plot and the linear fit line in red.
Multiple Linear Fit
import numpy as np
import matplotlib.pyplot as plt

# Generate some random data
x = np.array([1, 2, 3, 4, 5])
y = np.array([2, 4, 6, 8, 10])

# Fit a multiple linear regression line
coefficients = np.polyfit(x, y, 2)
fit_line = np.polyval(coefficients, x)

# Plot the original data and the linear fit
plt.scatter(x, y)
plt.plot(x, fit_line, color='green')
plt.show()
Output:
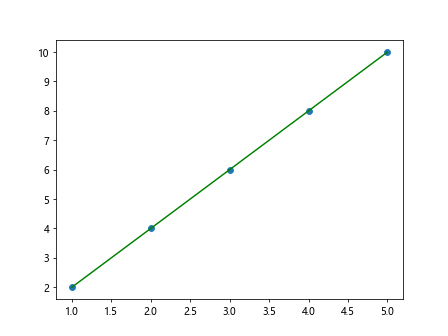
In the above code, we fit a multiple linear regression line using NumPy’s polyfit function with a degree of 2. This results in a quadratic fit to the data points. We then plot the original data points and the quadratic fit line in green.
Adding Noise to Data
import numpy as np
import matplotlib.pyplot as plt

# Generate some random data with noise
x = np.array([1, 2, 3, 4, 5])
y = np.array([2.1, 3.9, 6.2, 8.3, 9.6])

# Fit a linear regression line
slope, intercept = np.polyfit(x, y, 1)
fit_line = slope * x + intercept

# Plot the noisy data and the linear fit
plt.scatter(x, y)
plt.plot(x, fit_line, color='blue')
plt.show()
Output:
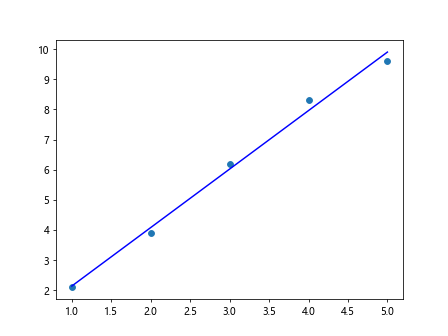
In the above code, we introduce some noise to the data points by slightly modifying the values of y. Despite the noisy data, we can still fit a linear regression line using the polyfit function. The resulting linear fit is plotted in blue.
Customizing Linear Fit Line
import numpy as np
import matplotlib.pyplot as plt

# Generate some random data
x = np.array([1, 2, 3, 4, 5])
y = np.array([2, 4, 6, 8, 10])

# Fit a linear regression line
slope, intercept = np.polyfit(x, y, 1)
fit_line = slope * x + intercept

# Plot the original data and the customized linear fit
plt.scatter(x, y)
plt.plot(x, fit_line, color='purple', linestyle='dashed', linewidth=2)
plt.xlabel('X-axis')
plt.ylabel('Y-axis')
plt.title('Linear Regression')
plt.show()
Output:
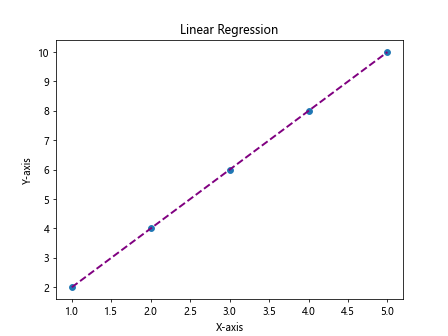
In the above code, we fit a linear regression line to the data points and customize the appearance of the fit line. We change the color to purple, the linestyle to dashed, and the linewidth to 2. Additionally, we label the x-axis, y-axis, and add a title to the plot.
Removing Outliers
import numpy as np
import matplotlib.pyplot as plt

# Generate some random data with outliers
x = np.array([1, 2, 3, 4, 5])
y = np.array([2, 4, 6, 800, 10])

# Fit a linear regression line
slope, intercept = np.polyfit(x, y, 1)
fit_line = slope * x + intercept

# Plot the data with outliers
plt.scatter(x, y)
plt.plot(x, fit_line, color='orange')
plt.show()
Output:
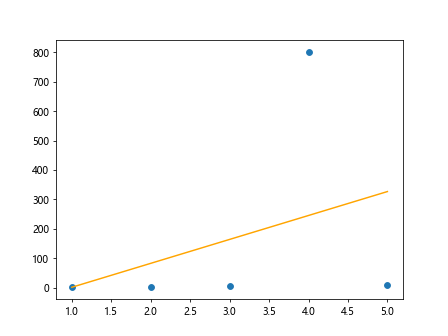
In the above code, we intentionally introduce an outlier in the data points by setting a value of 800 for one of the y values. Despite the outlier, we can still fit a linear regression line using the polyfit function. The outlier is clearly visible when plotting the data points along with the linear fit line in orange.
Ignoring Nan Values
import numpy as np
import matplotlib.pyplot as plt

# Generate some random data with NaN values
x = np.array([1, 2, 3, 4, 5])
y = np.array([2, np.nan, 6, 8, 10])

# Remove NaN values
x = x[~np.isnan(y)]
y = y[~np.isnan(y)]

# Fit a linear regression line
slope, intercept = np.polyfit(x, y, 1)
fit_line = slope * x + intercept

# Plot the cleaned data and the linear fit
plt.scatter(x, y)
plt.plot(x, fit_line, color='pink')
plt.show()
Output:
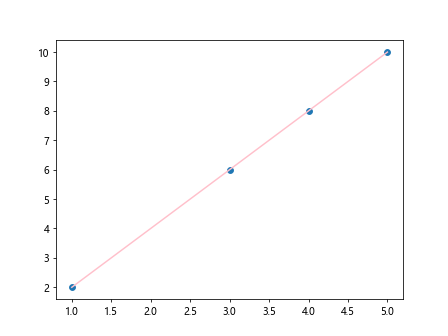
In the above code, we intentionally introduce a NaN (Not a Number) value in the data points by setting the second y value to np.nan. We then remove the NaN values from both x and y arrays before fitting a linear regression line. The cleaned data points are plotted along with the linear fit line in pink.
Using Subplots
import numpy as np
import matplotlib.pyplot as plt

# Generate some random data
x = np.array([1, 2, 3, 4, 5])
y = np.array([2, 4, 6, 8, 10])

# Fit a linear regression line
slope, intercept = np.polyfit(x, y, 1)
fit_line = slope * x + intercept

# Plot the original data and the linear fit using subplots
fig, axs = plt.subplots(2)
fig.suptitle('Linear Regression Subplots')
axs[0].scatter(x, y)
axs[0].set_title('Original Data')
axs[1].plot(x, fit_line, color='brown')
axs[1].set_title('Linear Fit')
plt.show()
Output:
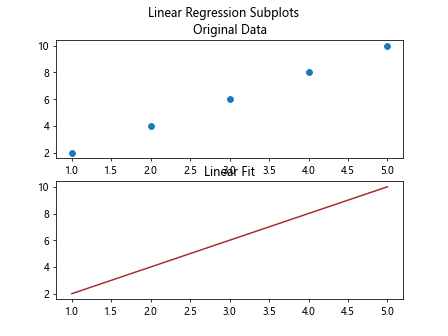
In the above code, we plot the original data points and the linear fit line using subplots. We create two subplots within a single figure, where the first subplot displays the original data points as a scatter plot, and the second subplot displays the linear fit line.
Non-Linear Fit
import numpy as np
import matplotlib.pyplot as plt

# Generate some random data
x = np.array([1, 2, 3, 4, 5])
y = np.array([2, 3, 5, 7, 11])

# Fit a non-linear regression line (exponential)
coefficients = np.polyfit(x, np.log(y), 1)
fit_line = np.exp(coefficients[1]) * np.exp(coefficients[0] * x)

# Plot the original data and the non-linear fit
plt.scatter(x, y)
plt.plot(x, fit_line, color='black')
plt.show()
Output:
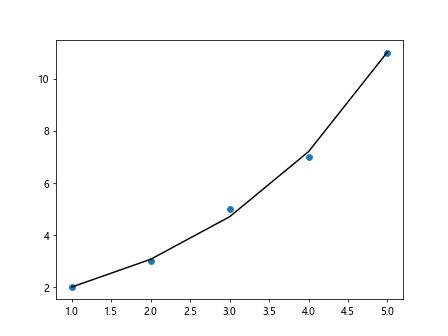
In the above code, we fit a non-linear regression line (exponential) to the data points by transforming the y values using the natural logarithm. We then use polyfit to fit a linear regression line to the log-transformed y, and transform the result back to the original scale. The non-linear fit line is plotted in black.
Handling Missing Data
import numpy as np
import matplotlib.pyplot as plt

# Generate some random data with missing values
x = np.array([1, 2, 3, 4, 5])
y = np.array([2, -1, 6, 8, -1])

# Remove missing values
x = x[y != -1]
y = y[y != -1]

# Fit a linear regression line
slope, intercept = np.polyfit(x, y, 1)
fit_line = slope * x + intercept

# Plot the cleaned data and the linear fit
plt.scatter(x, y)
plt.plot(x, fit_line, color='gray')
plt.show()
Output:
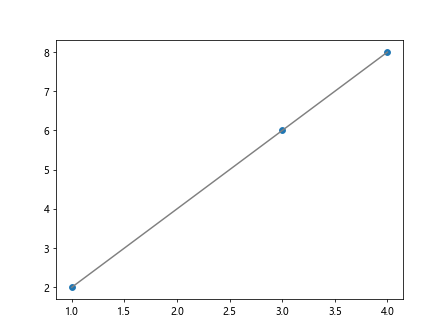
In the above code, we intentionally introduce missing values in the data points by setting certain y values to -1. We then remove the data points with missing values before fitting a linear regression line. The cleaned data points are plotted along with the linear fit line in gray.
Confidence Intervals
import numpy as np
import matplotlib.pyplot as plt

# Generate some random data
x = np.array([1, 2, 3, 4, 5])
y = np.array([2, 4, 5, 8, 9])

# Fit a linear regression line
slope, intercept = np.polyfit(x, y, 1)
fit_line = slope * x + intercept

# Calculate confidence intervals
from scipy import stats
slope_std_error = np.sqrt(np.sum((y - slope*x - intercept)**2) / (len(x) - 2))
t_value = stats.t.ppf(1-0.025, len(x)-2)
slope_ci_lower = slope - t_value * slope_std_error
slope_ci_upper = slope + t_value * slope_std_error

# Plot the original data, linear fit, and confidence intervals
plt.scatter(x, y)
plt.plot(x, fit_line, color='darkblue')
plt.fill_between(x, (slope_ci_lower*x + intercept), (slope_ci_upper*x + intercept), color='lightblue', alpha=0.5)
plt.show()
Output:
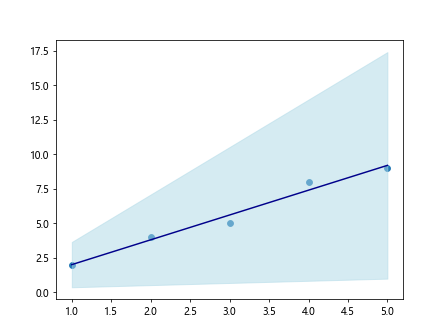
In the above code, we fit a linear regression line to the data points and calculate the confidence intervals for the slope. We use the Student’s t-distribution to calculate the confidence intervals at a 95% confidence level. The linear fit line is plotted in dark blue, while the confidence intervals are visualized with a light blue shaded region.
Residual Analysis
import numpy as np
import matplotlib.pyplot as plt

# Generate some random data
x = np.array([1, 2, 3, 4, 5])
y = np.array([2, 4, 6, 8, 10])

# Fit a linear regression line
slope, intercept = np.polyfit(x, y, 1)
fit_line = slope * x + intercept

# Calculate residuals
residuals = y - (slope * x + intercept)

# Plot the residuals
plt.scatter(x, residuals, color='red')
plt.axhline(0, color='black', linestyle='--')
plt.xlabel('X-values')
plt.ylabel('Residuals')
plt.title('Residual Plot')
plt.show()
Output:
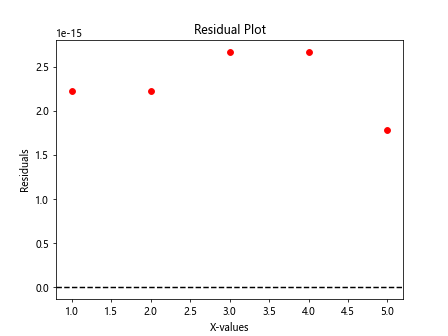
In the above code, we fit a linear regression line to the data points and calculate the residuals by subtracting the fitted values from the actual y values. We then plot the residuals against the x values, with a horizontal dashed line at y=0. The residuals plot helps us visualize the goodness of fit of the linear regression model.
Conclusion
In this article, we explored how to perform linear fit using Matplotlib. We covered various scenarios such as simple linear fit, multiple linear fit, adding noise to data, customizing fit lines, handling outliers and missing values, calculating confidence intervals, and residual analysis. By understanding and applying these techniques, you can effectively visualize and analyze linear relationships in your data using Matplotlib.
Remember, data visualization is a powerful tool in data analysis, and Matplotlib provides a flexible and intuitive interface for creating informative plots and visualizations. Experiment with the provided examples and explore the diverse capabilities of Matplotlib for linear fitting and regression analysis. Happy coding!