Matplotlib Lineplot
Matplotlib is a popular data visualization library in Python that allows you to create a variety of plots. One common type of plot is the line plot, which is used to visualize data points connected by straight lines. In this article, we will explore how to create line plots using Matplotlib.
Creating a Basic Line Plot
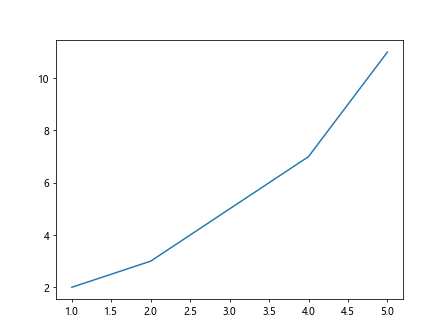
To create a basic line plot in Matplotlib, you can use the plot function. This function takes two arguments – the x-coordinates of the data points and the y-coordinates of the data points. Here is an example:
import matplotlib.pyplot as plt

# Data
x = [1, 2, 3, 4, 5]
y = [2, 3, 5, 7, 11]

plt.plot(x, y)
plt.show()
Output:
Customizing Line Plots
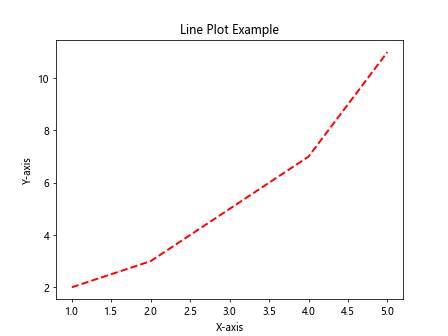
You can customize your line plot in Matplotlib by changing the line color, style, and width. You can also add labels to the x-axis and y-axis, and a title to the plot. Here is an example:
import matplotlib.pyplot as plt

# Data
x = [1, 2, 3, 4, 5]
y = [2, 3, 5, 7, 11]

plt.plot(x, y, color='r', linestyle='--', linewidth=2)
plt.xlabel('X-axis')
plt.ylabel('Y-axis')
plt.title('Line Plot Example')
plt.show()
Output:
Adding Multiple Lines to a Plot
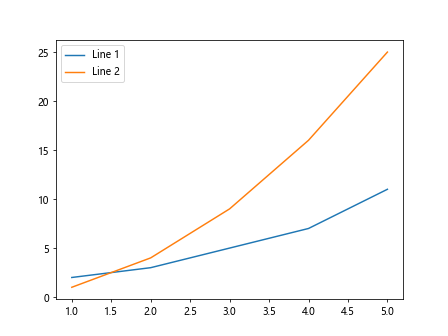
You can add multiple lines to a single plot in Matplotlib by calling the plot function multiple times. Each call will add a new line to the plot. Here is an example:
import matplotlib.pyplot as plt

# Data
x = [1, 2, 3, 4, 5]
y1 = [2, 3, 5, 7, 11]
y2 = [1, 4, 9, 16, 25]

plt.plot(x, y1, label='Line 1')
plt.plot(x, y2, label='Line 2')
plt.legend()
plt.show()
Output:
Changing Line Styles
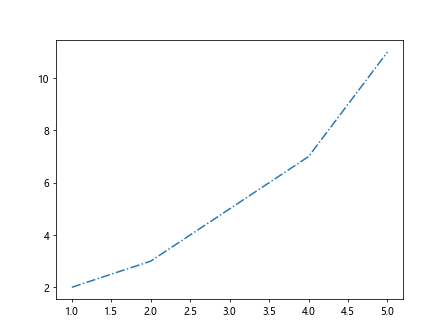
You can change the line style of a plot in Matplotlib by using different values for the linestyle argument in the plot function. Some common line styles include solid, dashed, and dotted. Here is an example:
import matplotlib.pyplot as plt

# Data
x = [1, 2, 3, 4, 5]
y = [2, 3, 5, 7, 11]

plt.plot(x, y, linestyle='-.')
plt.show()
Output:
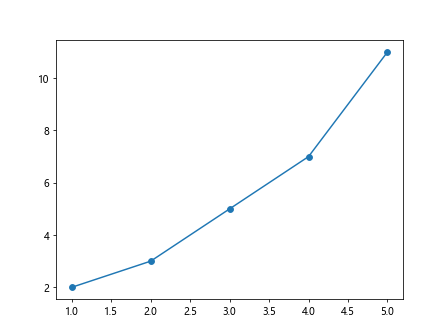
Adding Markers to Data Points
You can add markers to the data points in a line plot in Matplotlib by using the marker argument in the plot function. Some common markers include circles, squares, and triangles. Here is an example:
import matplotlib.pyplot as plt

# Data
x = [1, 2, 3, 4, 5]
y = [2, 3, 5, 7, 11]

plt.plot(x, y, marker='o')
plt.show()
Output:
Changing Marker Styles and Colors
You can change the style and color of the markers in a line plot in Matplotlib by using the marker argument and the markerfacecolor argument in the plot function. Here is an example:
import matplotlib.pyplot as plt

# Data
x = [1, 2, 3, 4, 5]
y = [2, 3, 5, 7, 11]

plt.plot(x, y, marker='s', markerfacecolor='g')
plt.show()
Output:

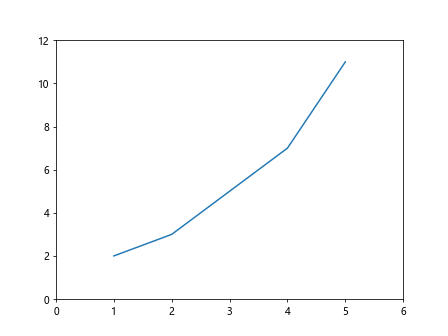
Customizing Axes Limits
You can customize the limits of the x-axis and y-axis in a line plot in Matplotlib by using the xlim and ylim functions. These functions take two arguments – the lower limit and the upper limit of the axis. Here is an example:
import matplotlib.pyplot as plt

# Data
x = [1, 2, 3, 4, 5]
y = [2, 3, 5, 7, 11]

plt.plot(x, y)
plt.xlim(0, 6)
plt.ylim(0, 12)
plt.show()
Output:
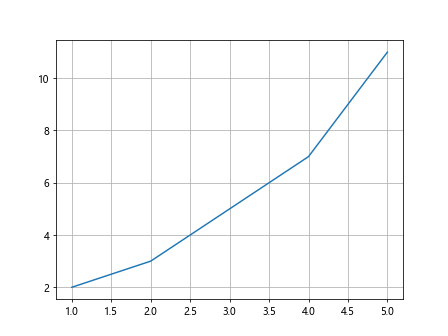
Adding Gridlines to a Plot
You can add gridlines to a plot in Matplotlib by using the grid function. This function takes a boolean argument – True to show gridlines, and False to hide gridlines. Here is an example:
import matplotlib.pyplot as plt

# Data
x = [1, 2, 3, 4, 5]
y = [2, 3, 5, 7, 11]

plt.plot(x, y)
plt.grid(True)
plt.show()
Output:
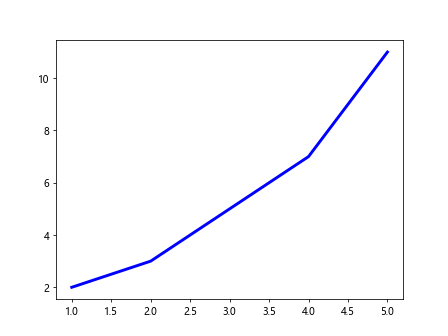
Changing Line Color and Width
You can change the color and width of the lines in a plot in Matplotlib by using the color argument and the linewidth argument in the plot function. Here is an example:
import matplotlib.pyplot as plt

# Data
x = [1, 2, 3, 4, 5]
y = [2, 3, 5, 7, 11]

plt.plot(x, y, color='b', linewidth=3)
plt.show()
Output:
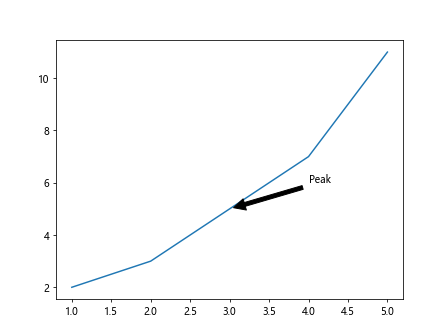
Adding Annotations to a Plot
You can add annotations to a plot in Matplotlib by using the annotate function. This function takes three arguments – the text of the annotation, the coordinates of the point to annotate, and the coordinates of the text. Here is an example:
import matplotlib.pyplot as plt

# Data
x = [1, 2, 3, 4, 5]
y = [2, 3, 5, 7, 11]

plt.plot(x, y)
plt.annotate('Peak', xy=(3, 5), xytext=(4, 6),
             arrowprops=dict(facecolor='black', shrink=0.05))
plt.show()
Output:
Saving a Plot to a File
You can save a plot in Matplotlib to a file by using the savefig function. This function takes one argument – the name of the file to save the plot to. Here is an example:
import matplotlib.pyplot as plt

# Data
x = [1, 2, 3, 4, 5]
y = [2, 3, 5, 7, 11]

plt.plot(x, y)
plt.savefig('lineplot.png')
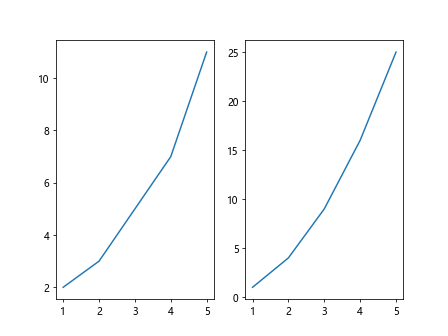
Displaying Multiple Plots
You can display multiple plots in Matplotlib by using the subplot function. This function takes three arguments – the number of rows, the number of columns, and the index of the plot. Here is an example:
import matplotlib.pyplot as plt

# Data
x = [1, 2, 3, 4, 5]
y1 = [2, 3, 5, 7, 11]
y2 = [1, 4, 9, 16, 25]

plt.subplot(1, 2, 1)
plt.plot(x, y1)
plt.subplot(1, 2, 2)
plt.plot(x, y2)
plt.show()
Output:
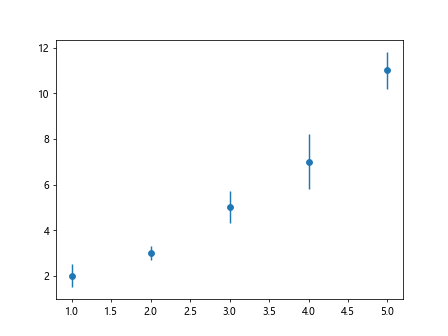
Adding Error Bars to a Plot
You can add error bars to a plot in Matplotlib by using the errorbar function. This function takes three arguments – the x-coordinates of the data points, the y-coordinates of the data points, and the error values. Here is an example:
import matplotlib.pyplot as plt

# Data
x = [1, 2, 3, 4, 5]
y = [2, 3, 5, 7, 11]
errors = [0.5, 0.3, 0.7, 1.2, 0.8]

plt.errorbar(x, y, yerr=errors, fmt='o')
plt.show()
Output:
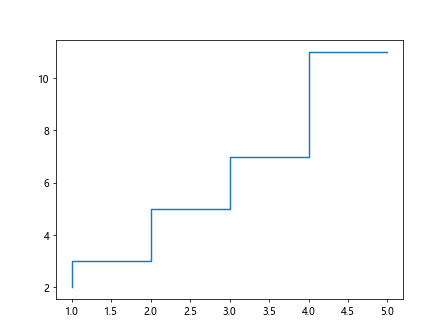
Creating a Step Line Plot
You can create a step line plot in Matplotlib by using the step function. This function takes two arguments – the x-coordinates of the data points and the y-coordinates of the data points. Here is an example:
import matplotlib.pyplot as plt

# Data
x = [1, 2, 3, 4, 5]
y = [2, 3, 5, 7, 11]

plt.step(x, y)
plt.show()
Output:
Creating a Stacked Line Plot
You can create a stacked line plot in Matplotlib by plotting multiple lines on the same axis with the bottom argument set to the y-coordinates of the previous line. Here is an example:
import matplotlib.pyplot as plt

# Data
x = [1, 2, 3, 4, 5]
y1 = [2, 3, 5, 7, 11]
y2 = [1, 4, 9, 16, 25]

plt.plot(x, y1, color='b')
plt.plot(x, y2, bottom=y1, color='r')
plt.show()
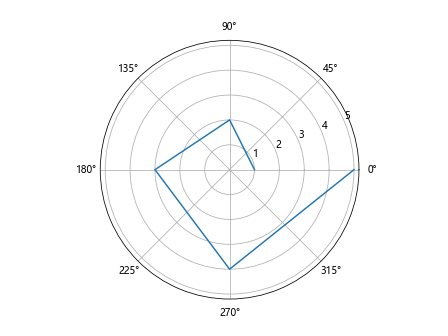
Creating a Polar Line Plot
You can create a polar line plot in Matplotlib by using the polar function along with the subplot function. Here is an example:
import matplotlib.pyplot as plt
import numpy as np

# Data
r = np.array([1, 2, 3, 4, 5])
theta = np.linspace(0, 2*np.pi, num=5)

plt.subplot(111, polar=True)
plt.plot(theta, r)
plt.show()
Output:
Conclusion
In this article, we have explored how to create line plots in Matplotlib. We have covered basic line plots, customizing line plots, adding multiple lines, changing line styles, adding markers, customizing axes limits, adding gridlines, changing line color and width, adding annotations, saving plots to files, displaying multiple plots, adding error bars, creating step line plots, stacked line plots, and polar line plots. Matplotlib offers a wide range of customization options for creating visually appealing line plots for your data visualization needs.