Matplotlib Line Size
Matplotlib is a popular Python library for creating static, animated, and interactive visualizations in Python. One common feature that users often need to customize is the size of lines in their plots. In this article, we will explore different ways to adjust the line size in Matplotlib plots.
Setting Line Width for Plots
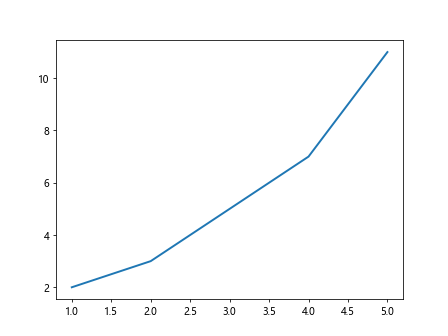
You can easily adjust the line width of plots in Matplotlib using the linewidth parameter in the plot() function. Here is an example:
import matplotlib.pyplot as plt

x = [1, 2, 3, 4, 5]
y = [2, 3, 5, 7, 11]

plt.plot(x, y, linewidth=2)
plt.show()
Output:
Using the set_linewidth() Method
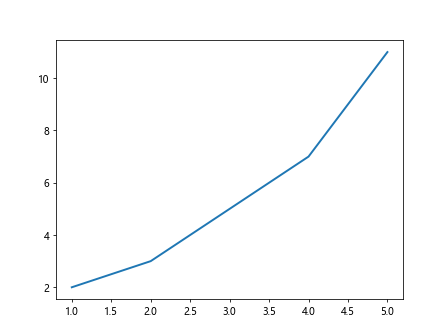
Another way to adjust the line width is by using the set_linewidth() method on the plot object. Here is an example:
import matplotlib.pyplot as plt

x = [1, 2, 3, 4, 5]
y = [2, 3, 5, 7, 11]

line, = plt.plot(x, y)
line.set_linewidth(2)
plt.show()
Output:
Customizing Line width in Different Plots
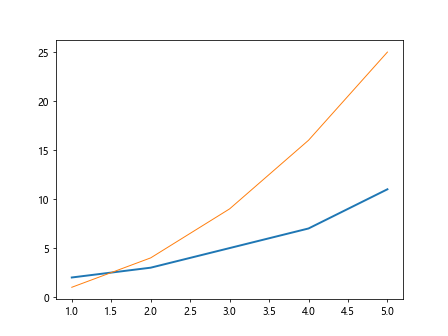
You can also customize the line width for different plots within the same figure. Here is an example:
import matplotlib.pyplot as plt

x1 = [1, 2, 3, 4, 5]
y1 = [2, 3, 5, 7, 11]
x2 = [1, 2, 3, 4, 5]
y2 = [1, 4, 9, 16, 25]

plt.plot(x1, y1, linewidth=2)
plt.plot(x2, y2, linewidth=1)
plt.show()
Output:
Using Line Width with Different Line Styles
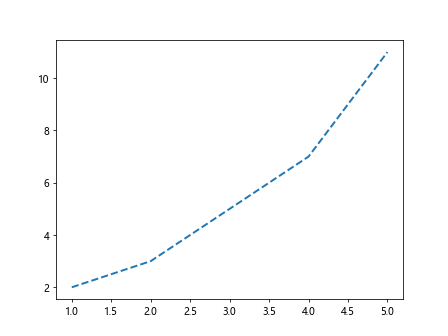
You can combine line width customization with different line styles in Matplotlib. Here is an example:
import matplotlib.pyplot as plt

x = [1, 2, 3, 4, 5]
y = [2, 3, 5, 7, 11]

plt.plot(x, y, linewidth=2, linestyle='--')
plt.show()
Output:
Adjusting Line Width in Scatter Plots
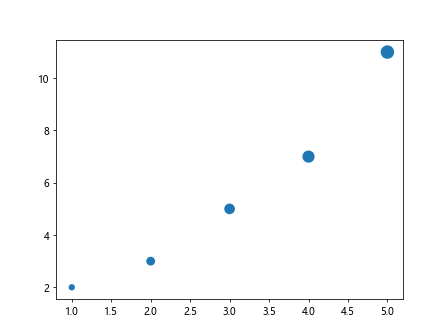
You can also adjust the line width in scatter plots using the linewidths parameter. Here is an example:
import matplotlib.pyplot as plt

x = [1, 2, 3, 4, 5]
y = [2, 3, 5, 7, 11]
sizes = [20, 50, 80, 110, 140]

plt.scatter(x, y, s=sizes, linewidths=2)
plt.show()
Output:
Changing Line Width in Bar Plots
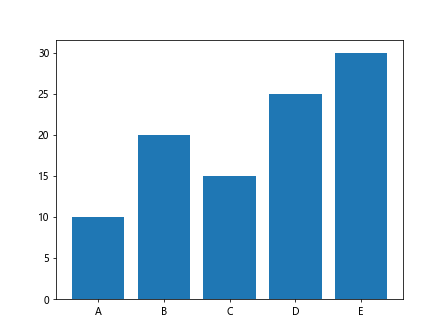
In bar plots, you can adjust the line width of the edges of the bars using the linewidth parameter. Here is an example:
import matplotlib.pyplot as plt

x = ['A', 'B', 'C', 'D', 'E']
y = [10, 20, 15, 25, 30]

plt.bar(x, y, linewidth=2)
plt.show()
Output:
Adjusting Line Width in Box Plots
Box plots can also have customized line widths for the box outlines using the linewidth parameter. Here is an example:
import matplotlib.pyplot as plt

data = [[1, 2, 3, 4, 5],
        [5, 4, 3, 2, 1],
        [3, 3, 3, 3, 3]]

plt.boxplot(data, linewidth=2)
plt.show()
Changing Line Width in Pie Charts
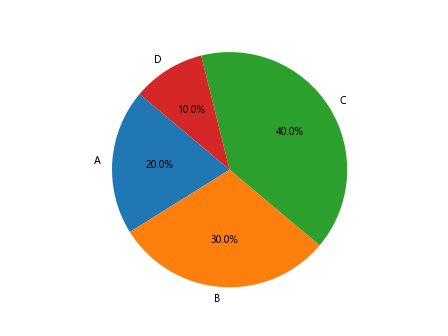
Even in pie charts, you can adjust the line width of the wedges using the linewidth parameter. Here is an example:
import matplotlib.pyplot as plt

sizes = [20, 30, 40, 10]
labels = ['A', 'B', 'C', 'D']

plt.pie(sizes, labels=labels, autopct='%1.1f%%', startangle=140, wedgeprops={'linewidth': 2})
plt.axis('equal')
plt.show()
Output:
Adjusting Line Width in Contour Plots
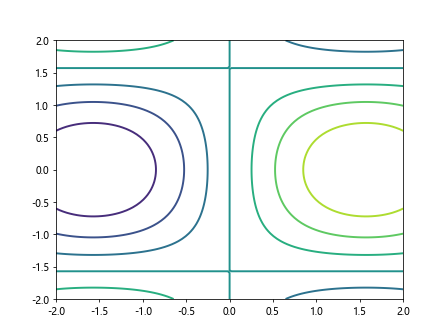
For contour plots, you can customize the line width of the contour lines using the linewidths parameter. Here is an example:
import matplotlib.pyplot as plt
import numpy as np

x = np.linspace(-2, 2, 100)
y = np.linspace(-2, 2, 100)
X, Y = np.meshgrid(x, y)
Z = np.sin(X) * np.cos(Y)

plt.contour(X, Y, Z, linewidths=2)
plt.show()
Output:
Using Different Colormaps with Line Width
You can combine different colormaps with line width customization in Matplotlib. Here is an example using the ‘viridis’ colormap:
import matplotlib.pyplot as plt
import numpy as np

x = np.linspace(-2, 2, 100)
y = np.linspace(-2, 2, 100)
X, Y = np.meshgrid(x, y)
Z = np.sin(X) * np.cos(Y)

plt.contourf(X, Y, Z, cmap='viridis', linewidths=2)
plt.colorbar()
plt.show()
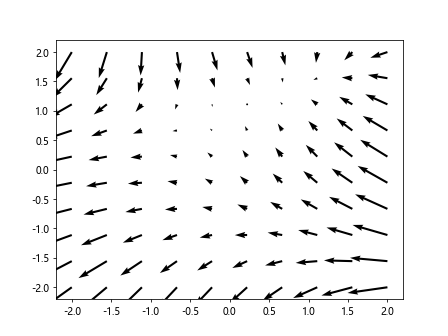
Controlling Line Width in Quiver Plots
In quiver plots, you can adjust the line width of the arrows using the linewidth parameter. Here is an example:
import matplotlib.pyplot as plt
import numpy as np

x = np.linspace(-2, 2, 10)
y = np.linspace(-2, 2, 10)
X, Y = np.meshgrid(x, y)
U = -1 - X**2 + Y
V = 1 + X - Y**2

plt.quiver(X, Y, U, V, linewidth=2)
plt.show()
Output:
Customizing Line Widths in Errorbar Plots
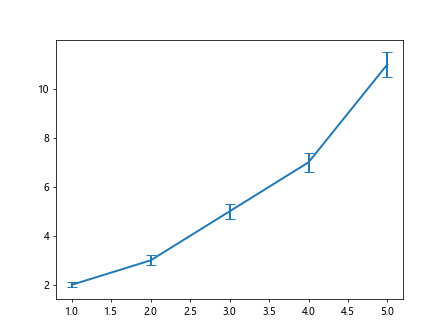
Errorbar plots also allow customization of line widths for the error bars using the capsize parameter. Here is an example:
import matplotlib.pyplot as plt

x = [1, 2, 3, 4, 5]
y = [2, 3, 5, 7, 11]
errors = [0.1, 0.2, 0.3, 0.4, 0.5]

plt.errorbar(x, y, yerr=errors, capsize=5, linewidth=2)
plt.show()
Output:
Adjusting Line Width for Stem Plots
Stem plots can have customized line widths for the stems using the linefmt parameter. Here is an example:
import matplotlib.pyplot as plt

x = [1, 2, 3, 4, 5]
y = [2, 3, 5, 7, 11]

plt.stem(x, y, linefmt='-g', markerfmt='ro', basefmt='b-', linewidth=2)
plt.show()
Conclusion
In this article, we have explored various ways to adjust the line width in Matplotlib plots. By utilizing the linewidth parameter and other relevant options in different plot types, you can customize the appearance of lines in your visualizations to better convey your data. Experiment with different line widths in your plots to find the best presentation for your data.