Matplotlib Line Styles
Matplotlib is a powerful Python library used for creating static, animated, and interactive visualizations in Python. One important feature of Matplotlib is its ability to customize the style of lines in plots, such as changing the line color, thickness, and style. In this article, we will explore different line styles that can be used in Matplotlib plots.
Solid Line
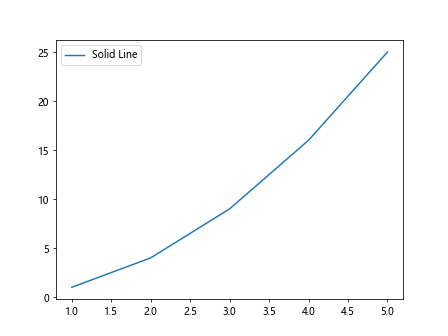
The most common line style in Matplotlib is the solid line. It is the default line style used when plotting data.
import matplotlib.pyplot as plt

x = [1, 2, 3, 4, 5]
y = [1, 4, 9, 16, 25]

plt.plot(x, y, linestyle='-', label='Solid Line')
plt.legend()
plt.show()
Output:
Dashed Line
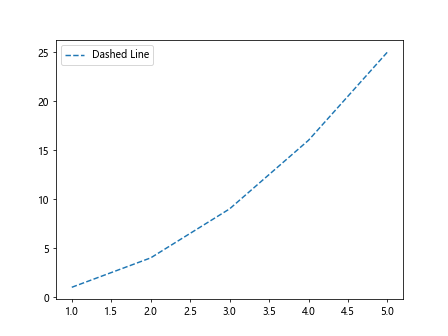
Another popular line style is the dashed line. It creates a line made up of dashes.
import matplotlib.pyplot as plt

x = [1, 2, 3, 4, 5]
y = [1, 4, 9, 16, 25]

plt.plot(x, y, linestyle='--', label='Dashed Line')
plt.legend()
plt.show()
Output:
Dotted Line
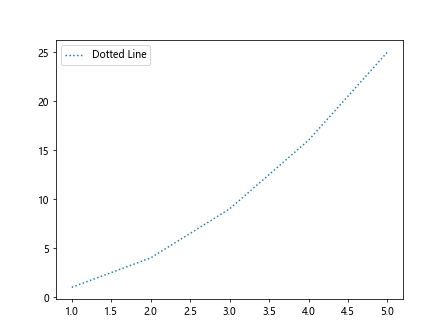
The dotted line style creates a line made up of dots.
import matplotlib.pyplot as plt

x = [1, 2, 3, 4, 5]
y = [1, 4, 9, 16, 25]

plt.plot(x, y, linestyle=':', label='Dotted Line')
plt.legend()
plt.show()
Output:
Dashdot Line
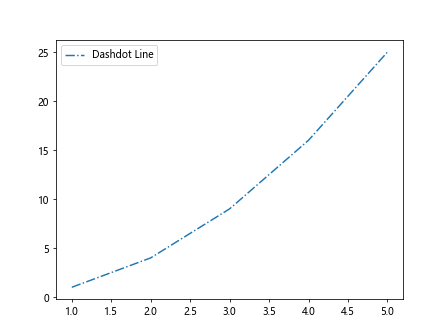
The dashdot line style combines dashes and dots to create a unique line style.
import matplotlib.pyplot as plt

x = [1, 2, 3, 4, 5]
y = [1, 4, 9, 16, 25]

plt.plot(x, y, linestyle='-.', label='Dashdot Line')
plt.legend()
plt.show()
Output:
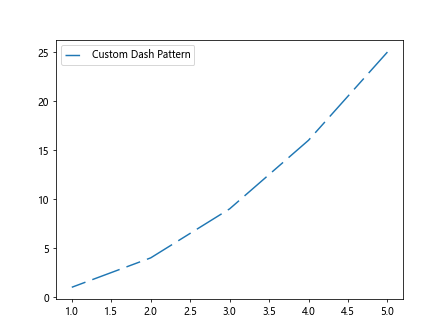
Custom Dash Patterns
Matplotlib also allows you to specify custom dash patterns for lines. You can pass a sequence of on/off lengths to the dashes parameter to create custom dash patterns.
import matplotlib.pyplot as plt

x = [1, 2, 3, 4, 5]
y = [1, 4, 9, 16, 25]

plt.plot(x, y, linestyle='-', dashes=[10, 5, 20, 5], label='Custom Dash Pattern')
plt.legend()
plt.show()
Output:
Combining Line Styles
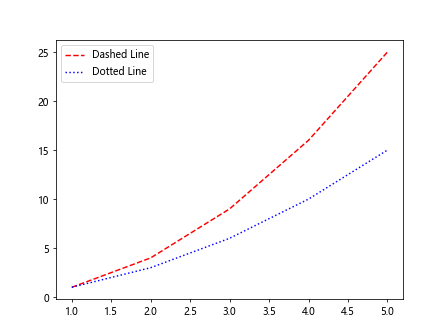
You can combine different line styles and colors to create more visually appealing plots.
import matplotlib.pyplot as plt

x = [1, 2, 3, 4, 5]
y1 = [1, 4, 9, 16, 25]
y2 = [1, 3, 6, 10, 15]

plt.plot(x, y1, linestyle='--', color='red', label='Dashed Line')
plt.plot(x, y2, linestyle=':', color='blue', label='Dotted Line')
plt.legend()
plt.show()
Output:
Line Width
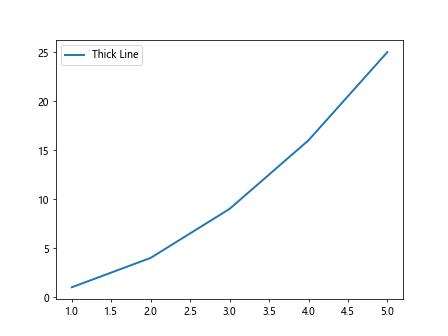
In addition to changing line styles, you can also adjust the line width in Matplotlib plots.
import matplotlib.pyplot as plt

x = [1, 2, 3, 4, 5]
y = [1, 4, 9, 16, 25]

plt.plot(x, y, linestyle='-', linewidth=2, label='Thick Line')
plt.legend()
plt.show()
Output:
Transparency
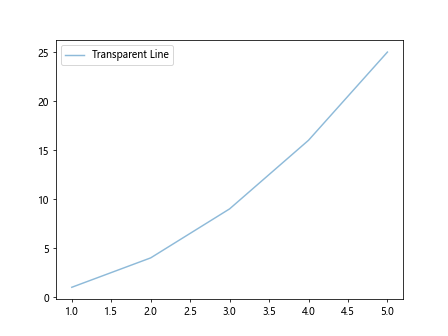
You can also adjust the transparency of lines in Matplotlib plots using the alpha parameter. A value of 0 is fully transparent, while a value of 1 is fully opaque.
import matplotlib.pyplot as plt

x = [1, 2, 3, 4, 5]
y = [1, 4, 9, 16, 25]

plt.plot(x, y, linestyle='-', alpha=0.5, label='Transparent Line')
plt.legend()
plt.show()
Output:
Line Style Cycle
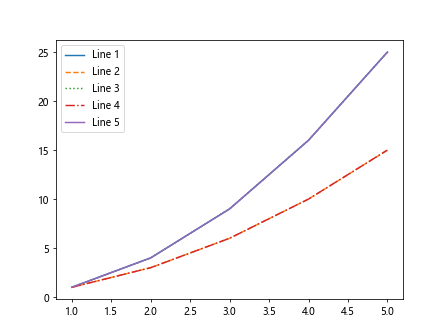
Matplotlib also provides a way to cycle through different line styles automatically by using the linestyle parameter.
import matplotlib.pyplot as plt

x = [1, 2, 3, 4, 5]
y1 = [1, 4, 9, 16, 25]
y2 = [1, 3, 6, 10, 15]

plt.plot(x, y1, label='Line 1')
plt.plot(x, y2, linestyle='--', label='Line 2')
plt.plot(x, y1, linestyle=':', label='Line 3')
plt.plot(x, y2, linestyle='-.', label='Line 4')
plt.plot(x, y1, linestyle='-', label='Line 5')
plt.legend()
plt.show()
Output:
Conclusion
In this article, we explored different line styles in Matplotlib and learned how to customize the appearance of lines in plots. By using the various line styles, colors, widths, and transparency options available in Matplotlib, you can create visually appealing and informative visualizations for your data. Experiment with different combinations of these features to create plots that effectively communicate your data.