Matplotlib Line Weight
Matplotlib is a popular Python library used for creating static, interactive, and animated visualizations in Python. One important aspect of creating visualizations is customizing the appearance of the elements, such as lines. In this article, we will explore how to adjust the line weight in Matplotlib.
Basic Line Plot with Default Line Weight
import matplotlib.pyplot as plt

x = [1, 2, 3, 4, 5]
y = [2, 3, 5, 7, 11]

plt.plot(x, y)
plt.show()
Output:
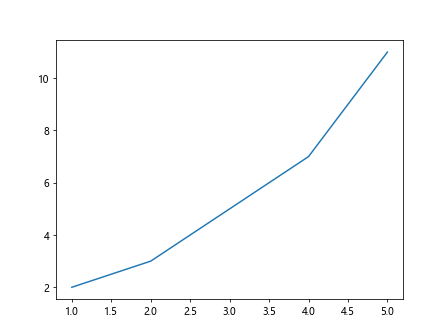
In the basic line plot above, the default line weight is used. If you run the code, you will see a line plot with the default line weight.
Adjusting Line Weight
You can easily adjust the line weight in Matplotlib using the linewidth or lw parameter in the plot() function. The line weight is specified in points.
import matplotlib.pyplot as plt

x = [1, 2, 3, 4, 5]
y = [2, 3, 5, 7, 11]

plt.plot(x, y, linewidth=2)
plt.show()
Output:
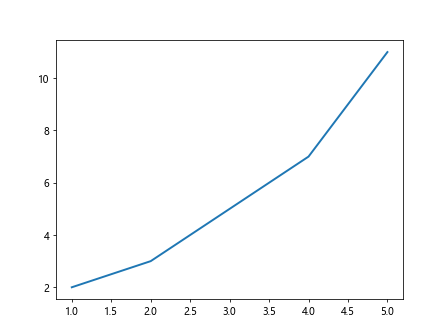
In the example above, the line weight is set to 2 points. You can adjust the line weight to make the line more visible or emphasize certain elements in your plots.
Line Weight in Scatter Plot
You can also customize the line weight when creating scatter plots in Matplotlib. The line weight refers to the thickness of the marker edge in a scatter plot.
import matplotlib.pyplot as plt

x = [1, 2, 3, 4, 5]
y = [2, 3, 5, 7, 11]

plt.scatter(x, y, edgecolors='black', linewidth=2)
plt.show()
Output:
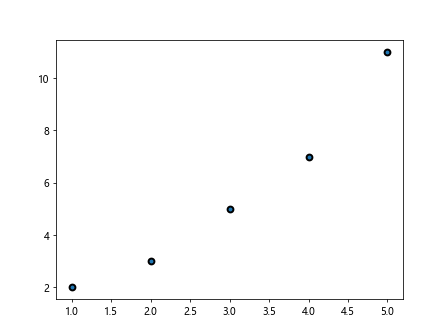
In the scatter plot example above, the edge color of the markers is set to black and the line weight is set to 2 points. This customization helps distinguish the markers from the background grid or other elements in the plot.
Line Weight in Bar Plot
When creating bar plots in Matplotlib, you can also adjust the line weight of the bars.
import matplotlib.pyplot as plt

x = [1, 2, 3, 4, 5]
y = [2, 3, 5, 7, 11]

plt.bar(x, y, linewidth=2)
plt.show()
Output:
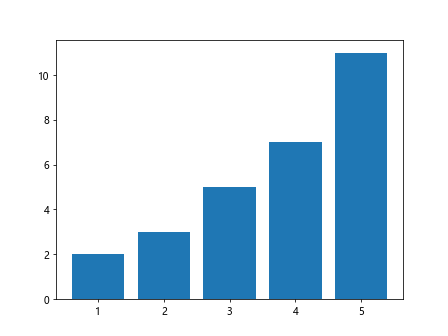
In the bar plot example above, the line weight of the bars is set to 2 points. This customization can help make the bars more prominent in the plot.
Line Weight in Histogram
In histograms, the line weight refers to the thickness of the border around the bars in the histogram.
import matplotlib.pyplot as plt
import numpy as np

data = np.random.randn(1000)

plt.hist(data, bins=30, edgecolor='black', linewidth=2)
plt.show()
Output:
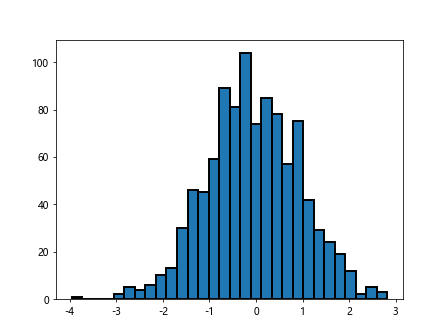
In the histogram example above, the border around each bar in the histogram is set to black with a line weight of 2 points. This customization can help delineate the bars in the histogram from the background.
Multiple Line Plots with Different Line Weights
You can create multiple line plots with different line weights in the same figure.
import matplotlib.pyplot as plt

x = [1, 2, 3, 4, 5]
y1 = [2, 3, 5, 7, 11]
y2 = [1, 4, 6, 8, 10]

plt.plot(x, y1, linewidth=2)
plt.plot(x, y2, linewidth=3)
plt.show()
Output:
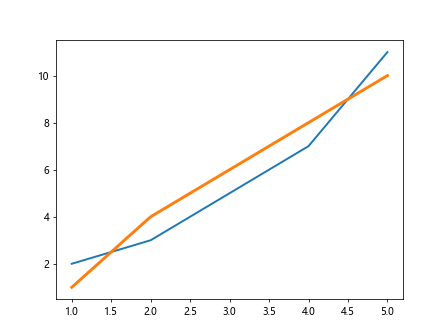
In the example above, two line plots are created with different line weights. The first line plot has a line weight of 2 points, while the second line plot has a line weight of 3 points.
Customizing Line Style and Line Weight
You can further customize the appearance of the lines in your plots by combining line styles with different line weights.
import matplotlib.pyplot as plt

x = [1, 2, 3, 4, 5]
y = [2, 3, 5, 7, 11]

plt.plot(x, y, linestyle='--', linewidth=2)
plt.show()
Output:
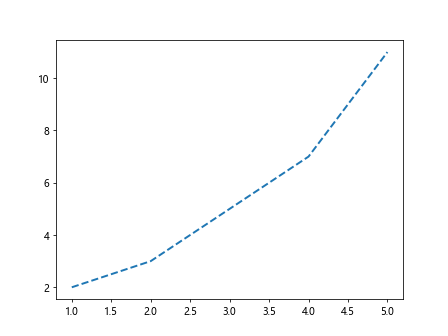
In the example above, the line style is set to dashed (--) and the line weight is set to 2 points, creating a dashed line plot with a thicker line weight.
Line Weight in Subplots
When creating subplots in Matplotlib, you can specify different line weights for each subplot.
import matplotlib.pyplot as plt

x = [1, 2, 3, 4, 5]
y = [2, 3, 5, 7, 11]

plt.figure(figsize=(10, 5))

plt.subplot(1, 2, 1)
plt.plot(x, y, linewidth=2)

plt.subplot(1, 2, 2)
plt.plot(x, y, linewidth=3)

plt.show()
Output:
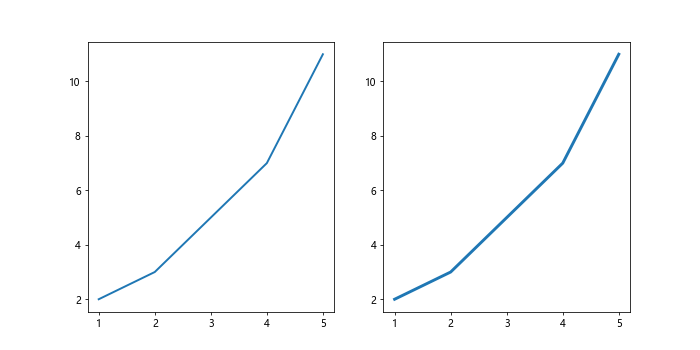
In the example above, two subplots are created with different line weights. The first subplot has a line weight of 2 points, while the second subplot has a line weight of 3 points.
Line Weight with Legends
When adding legends to your plots, you can customize the line weight of the legend lines.
import matplotlib.pyplot as plt

x = [1, 2, 3, 4, 5]
y = [2, 3, 5, 7, 11]

plt.plot(x, y, label='Line 1', linewidth=2)
plt.legend(handlelength=2)
plt.show()
Output:
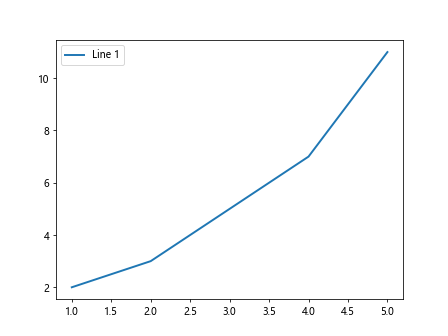
In the example above, the line weight of the legend line for “Line 1” is set to 2 points. This customization can help make the legend lines more visible in the plot.
Line Weight in 3D Plots
You can also adjust the line weight in 3D plots in Matplotlib.
import matplotlib.pyplot as plt
from mpl_toolkits.mplot3d import Axes3D
import numpy as np

fig = plt.figure()
ax = fig.add_subplot(111, projection='3d')

x = np.random.normal(size=500)
y = np.random.normal(size=500)
z = np.random.normal(size=500)

ax.scatter(x, y, z, linewidth=2)
plt.show()
Output:
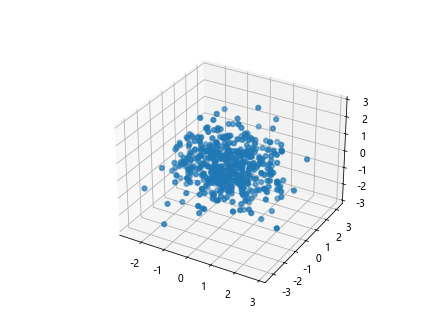
In the 3D scatter plot example above, the line weight of the markers is set to 2 points. This customization can help enhance the visibility of the markers in the 3D plot.
Conclusion
Adjusting the line weight in Matplotlib is a useful way to customize the appearance of lines, markers, and borders in your plots. By specifying the line weight in points, you can make certain elements more prominent, emphasize specific trends, and enhance the overall aesthetics of your visualizations. Experiment with different line weights in your plots to find the best visual representation for your data.