Matplotlib Line Thickness
Matplotlib is a popular data visualization library in Python that provides various types of plots and charts to visualize data. One important aspect of any plot is the line thickness, which can help emphasize the data being presented. In this article, we will explore how to customize the line thickness in matplotlib plots.
1. Basic Line Plot with Custom Line Thickness
import matplotlib.pyplot as plt

x = [1, 2, 3, 4, 5]
y = [10, 20, 15, 25, 30]

plt.plot(x, y, linewidth=2)
plt.show()
Output:
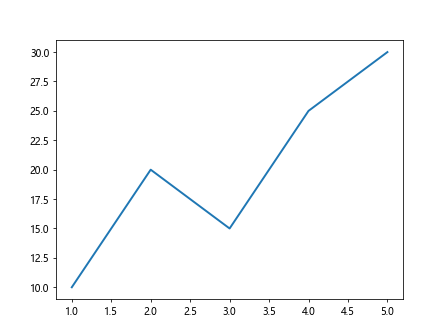
In this example, we create a basic line plot with custom line thickness set to 2 using the linewidth parameter in the plot() function.
2. Custom Line Thickness for Scatter Plot
import matplotlib.pyplot as plt

x = [1, 2, 3, 4, 5]
y = [10, 20, 15, 25, 30]

plt.scatter(x, y, s=100, linewidth=2)
plt.show()
Output:
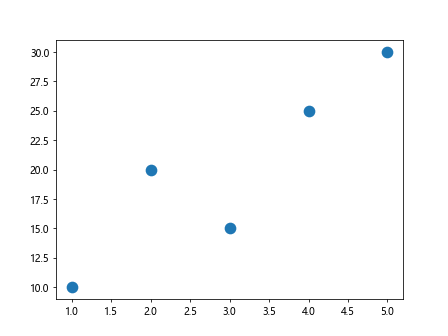
In this example, we create a scatter plot with custom line thickness set to 2 using the linewidth parameter in the scatter() function.
3. Line Thickness in Bar Plot
import matplotlib.pyplot as plt

x = ['A', 'B', 'C', 'D', 'E']
y = [25, 30, 35, 40, 45]

plt.bar(x, y, linewidth=2)
plt.show()
Output:
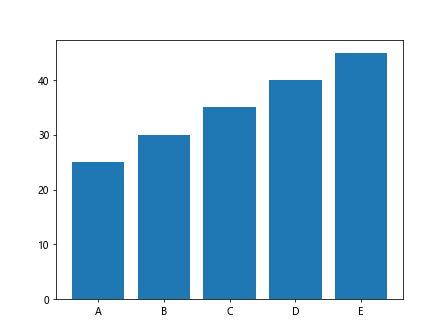
In this example, we create a bar plot with custom line thickness set to 2 using the linewidth parameter in the bar() function.
4. Line Thickness in Horizontal Bar Plot
import matplotlib.pyplot as plt

x = ['A', 'B', 'C', 'D', 'E']
y = [25, 30, 35, 40, 45]

plt.barh(x, y, linewidth=2)
plt.show()
Output:
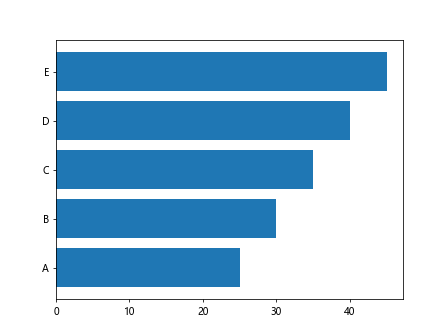
In this example, we create a horizontal bar plot with custom line thickness set to 2 using the linewidth parameter in the barh() function.
5. Line Thickness in Pie Chart
import matplotlib.pyplot as plt

sizes = [20, 30, 25, 25]
labels = ['A', 'B', 'C', 'D']

plt.pie(sizes, labels=labels, autopct='%1.1f%%', startangle=140, linewidth=2)
plt.show()
In this example, we create a pie chart with custom line thickness set to 2 using the linewidth parameter in the pie() function.
6. Multiple Lines with Different Thickness
import matplotlib.pyplot as plt

x = [1, 2, 3, 4, 5]
y1 = [10, 20, 15, 25, 30]
y2 = [15, 18, 20, 22, 24]

plt.plot(x, y1, linewidth=2)
plt.plot(x, y2, linewidth=4)
plt.show()
Output:
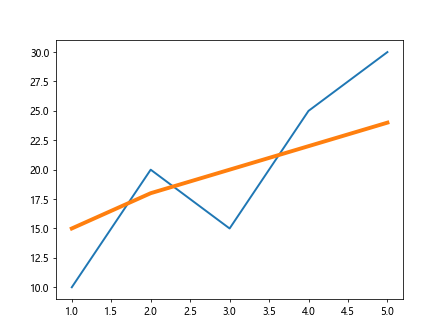
In this example, we create a plot with multiple lines, each with different line thicknesses set using the linewidth parameter in the plot() function.
7. Customizing Line Thickness in Subplots
import matplotlib.pyplot as plt

x = [1, 2, 3, 4, 5]
y1 = [10, 20, 15, 25, 30]
y2 = [15, 18, 20, 22, 24]

plt.subplot(1, 2, 1)
plt.plot(x, y1, linewidth=2)

plt.subplot(1, 2, 2)
plt.plot(x, y2, linewidth=4)

plt.show()
Output:
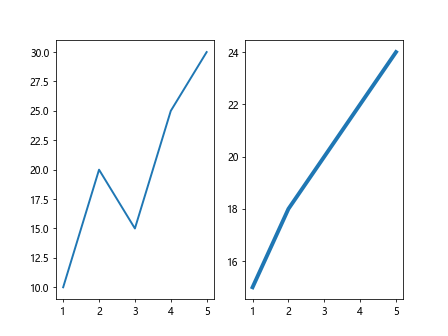
In this example, we create subplots with different line thicknesses set for each plot using the linewidth parameter in the plot() function.
8. Line Thickness in Line Collection Plot
import numpy as np
import matplotlib.pyplot as plt
from matplotlib.collections import LineCollection

x = np.linspace(0, 10, 100)
y1 = np.sin(x)
y2 = np.cos(x)

points = np.array([x, y1]).T.reshape(-1, 1, 2)
segments = np.concatenate([points[:-1], points[1:]], axis=1)

lc = LineCollection(segments, linewidth=2)
plt.gca().add_collection(lc)
plt.show()
Output:
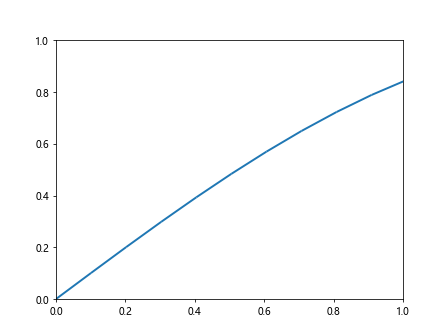
In this example, we create a Line Collection plot with custom line thickness set to 2 using the linewidth parameter in the LineCollection constructor.
9. Line Thickness in Stem Plot
import matplotlib.pyplot as plt

x = [1, 2, 3, 4, 5]
y = [10, 20, 15, 25, 30]

plt.stem(x, y, linefmt='-g', markerfmt='ro', basefmt='b', linewidth=2)
plt.show()
In this example, we create a stem plot with custom line thickness set to 2 using the linewidth parameter in the stem() function.
10. Line Thickness in Quiver Plot
import matplotlib.pyplot as plt
import numpy as np

x = np.arange(-10, 10, 1)
y = np.arange(-10, 10, 1)
u, v = np.meshgrid(x, y)

plt.quiver(x, y, u, v, linewidth=2)
plt.show()
Output:
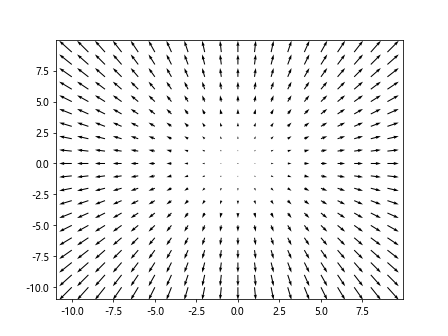
In this example, we create a quiver plot with custom line thickness set to 2 using the linewidth parameter in the quiver() function.
Conclusion
In this article, we explored how to customize the line thickness in various types of plots using matplotlib in Python. Line thickness is an important aspect of data visualization that can help convey information more effectively. By adjusting the line thickness, you can create more visually appealing and informative plots.Experiment with different line thickness values to find the best representation for your data.