matplotlib linewidth
In this article, we will explore the concept of setting linewidth in Matplotlib. Linewidth is a key parameter that determines the thickness of lines in plots created using Matplotlib. By adjusting the linewidth, you can control the visual appearance of lines in your plots. We will look at different ways to set the linewidth for various elements in Matplotlib plots, such as lines, markers, and text.
Set Linewidth for Lines
You can set the linewidth for lines in Matplotlib using the linewidth parameter in the plot() function. Here’s an example code snippet that demonstrates how to set the linewidth for a line plot:
import matplotlib.pyplot as plt

x = [1, 2, 3, 4, 5]
y = [2, 3, 5, 7, 11]

plt.plot(x, y, linewidth=2)
plt.show()
Output:
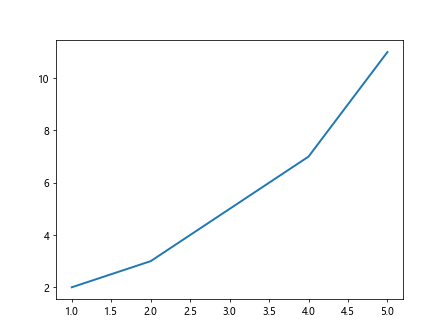
In the above code, the linewidth parameter is set to 2, which means the thickness of the line will be 2.
Set Linewidth for Markers
You can set the linewidth for markers in Matplotlib using the linewidth parameter in the plot() function. Here’s an example code snippet that demonstrates how to set the linewidth for markers in a scatter plot:
import matplotlib.pyplot as plt

x = [1, 2, 3, 4, 5]
y = [2, 3, 5, 7, 11]

plt.scatter(x, y, linewidth=2)
plt.show()
Output:
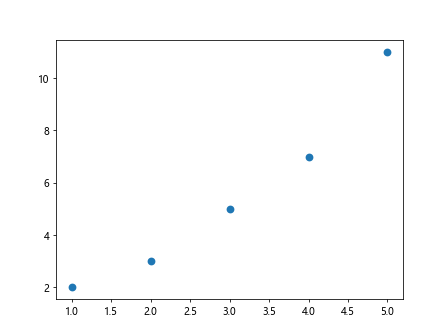
In the above code, the linewidth parameter is set to 2, which means the thickness of the marker edge will be 2.
Set Linewidth for Text
You can also set the linewidth for text elements in Matplotlib, such as labels and annotations. Here’s an example code snippet that demonstrates how to set the linewidth for text:
import matplotlib.pyplot as plt

plt.text(0.5, 0.5, 'how2matplotlib.com', fontsize=12, bbox=dict(facecolor='white', edgecolor='black', linewidth=2))
plt.show()
Output:
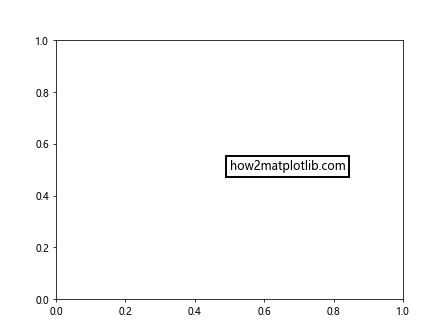
In the above code, the linewidth parameter is set to 2, which means the thickness of the text box edge will be 2.
Change Linewidth Dynamically
You can also change the linewidth dynamically based on certain conditions in your code. Here’s an example code snippet that demonstrates how to change the linewidth based on a condition:
import matplotlib.pyplot as plt

x = [1, 2, 3, 4, 5]
y = [2, 3, 5, 7, 11]

condition = True

if condition:
    linewidth = 2
else:
    linewidth = 1

plt.plot(x, y, linewidth=linewidth)
plt.show()
Output:
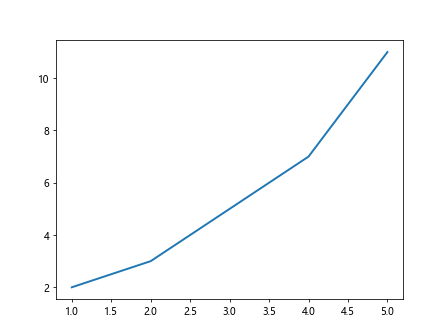
In the above code, the linewidth of the line plot will be set to 2 if the condition is True, and 1 otherwise.
Set Default Linewidth
You can set the default linewidth for all elements in a Matplotlib plot using the rcParams dictionary. Here’s an example code snippet that demonstrates how to set the default linewidth for all elements in a plot:
import matplotlib.pyplot as plt
plt.rcParams['lines.linewidth'] = 2

x = [1, 2, 3, 4, 5]
y = [2, 3, 5, 7, 11]

plt.plot(x, y)
plt.show()
Output:
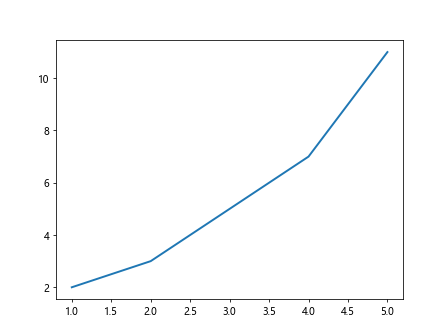
In the above code, the default linewidth for all lines in the plot is set to 2.
Use Linewidth in Different Plot Types
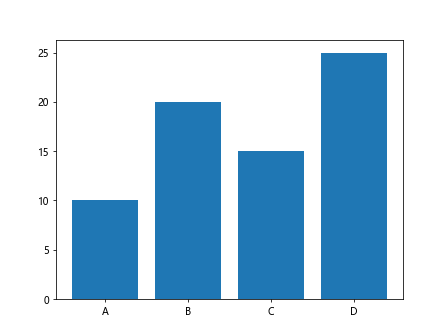
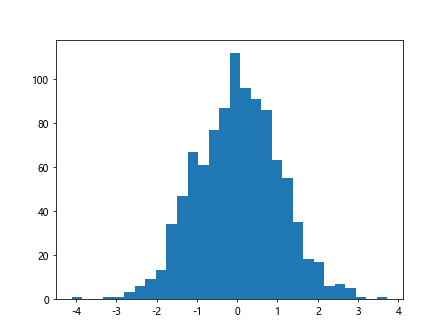
You can use linewidth parameter in various plot types in Matplotlib, such as bar plots, histogram plots, and pie charts. Here are some examples to demonstrate setting linewidth in different plot types:
- Bar Plot
import matplotlib.pyplot as plt

x = ['A', 'B', 'C', 'D']
y = [10, 20, 15, 25]

plt.bar(x, y, linewidth=2)
plt.show()
Output:
- Histogram Plot
import matplotlib.pyplot as plt
import numpy as np

data = np.random.randn(1000)

plt.hist(data, bins=30, linewidth=2)
plt.show()
Output:
- Pie Chart
import matplotlib.pyplot as plt

sizes = [20, 30, 25, 25]
labels = ['A', 'B', 'C', 'D']

plt.pie(sizes, labels=labels, autopct='%1.1f%%', startangle=140, counterclock=False, linewidth=2)
plt.show()
In each of the above examples, the linewidth parameter is set to 2 to control the thickness of lines in the plots.
Customize Linewidth Styles
You can customize the linewidth styles in Matplotlib using different line styles, such as solid, dashed, and dotted lines. Here’s an example code snippet that demonstrates setting different line styles:
import matplotlib.pyplot as plt

x = [1, 2, 3, 4, 5]
y1 = [2, 3, 5, 7, 11]
y2 = [1, 4, 6, 8, 10]

plt.plot(x, y1, linestyle='-', linewidth=2, label='Line 1 (Solid)')
plt.plot(x, y2, linestyle='--', linewidth=2, label='Line 2 (Dashed)')
plt.legend()
plt.show()
Output:
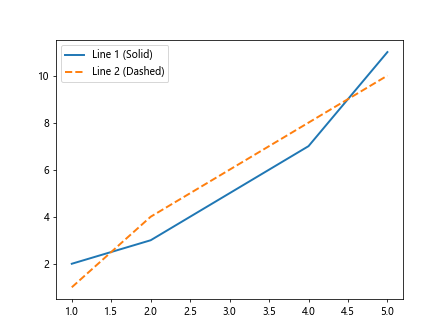
In the above code, the first line uses a solid line style, while the second line uses a dashed line style, both with a linewidth of 2.
Conclusion
In this article, we have explored the concept of setting linewidth in Matplotlib. We have discussed how to set the linewidth for lines, markers, and text elements in plots. We have also demonstrated how to change the linewidth dynamically, set default linewidth, use linewidth in different plot types, and customize linewidth styles. By mastering the linewidth parameter in Matplotlib, you can create visually appealing plots with the desired line thickness.