Increase Spacing Between Subplots in Matplotlib
When creating plots with multiple subplots in Matplotlib, you may find that the default spacing between subplots is not sufficient for your needs. In this article, we will explore different methods to increase the spacing between subplots in Matplotlib.
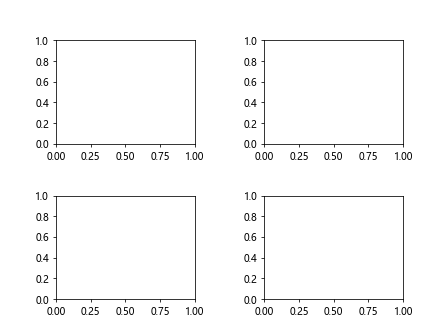
Method 1: Adjusting Figure Subplots Parameters
One way to increase the spacing between subplots is to adjust the parameters of the subplots in the Figure. The subplots_adjust() method allows you to control the spacing between subplots by adjusting the left, right, bottom, and top parameters.
Here is an example code snippet that demonstrates how to use subplots_adjust() to increase the spacing between subplots:
import matplotlib.pyplot as plt

fig, axs = plt.subplots(2, 2)

# Increase spacing between subplots
fig.subplots_adjust(hspace=0.5, wspace=0.5)

plt.show()
Output:
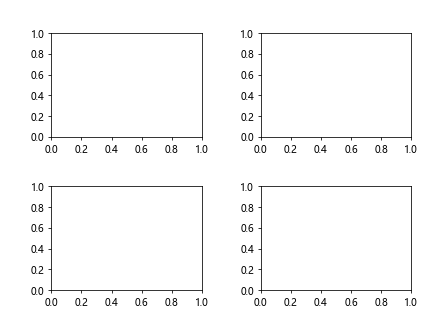
Method 2: Using GridSpec to Create Subplots
Another method to increase the spacing between subplots is to use GridSpec to create subplots in a more flexible way. By specifying the hspace and wspace parameters when creating the GridSpec, you can control the spacing between subplots.
Here is an example code snippet that shows how to use GridSpec to increase the spacing between subplots:
import matplotlib.pyplot as plt
from matplotlib.gridspec import GridSpec

fig = plt.figure()

gs = GridSpec(2, 2, hspace=0.5, wspace=0.5)
ax1 = fig.add_subplot(gs[0, 0])
ax2 = fig.add_subplot(gs[0, 1])
ax3 = fig.add_subplot(gs[1, 0])
ax4 = fig.add_subplot(gs[1, 1])

plt.show()
Output:

Method 3: Using Tight Layout
Matplotlib also provides a tight_layout() function that adjusts the spacing between subplots automatically to maximize the use of the available space. This can be a convenient option when you want to maintain a uniform spacing between subplots.
Here is an example code snippet that demonstrates how to use tight_layout() to increase the spacing between subplots:
import matplotlib.pyplot as plt

fig, axs = plt.subplots(2, 2)

plt.tight_layout(pad=3.0)

plt.show()
Output:
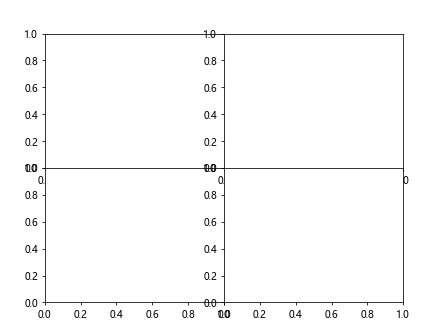
Method 4: Manually Adjusting Subplot Positions
Alternatively, you can manually adjust the positions of the subplots to increase the spacing between them. By specifying the position of each subplot in relation to the Figure coordinates, you can create custom spacing between subplots.
Here is an example code snippet that showcases how to manually adjust the positions of subplots:
import matplotlib.pyplot as plt

fig = plt.figure()
ax1 = fig.add_axes([0.1, 0.5, 0.4, 0.4])
ax2 = fig.add_axes([0.1, 0.1, 0.4, 0.4])
ax3 = fig.add_axes([0.5, 0.5, 0.4, 0.4])
ax4 = fig.add_axes([0.5, 0.1, 0.4, 0.4])

plt.show()
Output:
Method 5: Adjusting Spacing Using GridSpec Layout
You can also use the GridSpec layout to adjust the spacing between subplots by specifying the top, bottom, left, and right parameters. This allows you to customize the relative positions of subplots within the Figure.
Here is an example code snippet that demonstrates how to use GridSpec layout to adjust spacing between subplots:
import matplotlib.pyplot as plt
from matplotlib.gridspec import GridSpec

fig, axs = plt.subplots(2, 2)

gs = axs[0, 0].get_gridspec()
# Adjust spacing using GridSpec layout
for ax in axs:
    ax.remove()
new_ax = fig.add_subplot(gs[0, 0])
fig.add_subplot(gs[0, 1])

plt.show()
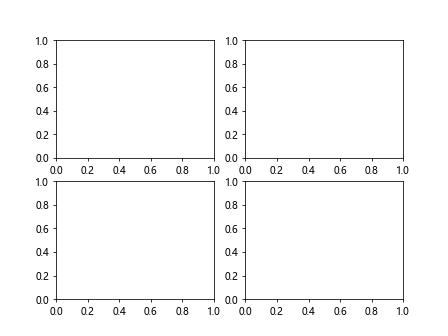
Method 6: Using Subplot2grid Function
The subplot2grid() function allows you to create subplots with custom sizes and positions in a grid-like layout. By specifying the colspan and rowspan parameters, you can control the size of each subplot and the spacing between them.
Here is an example code snippet that shows how to use subplot2grid() function to increase the spacing between subplots:
import matplotlib.pyplot as plt

fig = plt.figure()

# Create subplots with custom sizes and positions
ax1 = plt.subplot2grid((2, 2), (0, 0))
ax2 = plt.subplot2grid((2, 2), (0, 1))
ax3 = plt.subplot2grid((2, 2), (1, 0))
ax4 = plt.subplot2grid((2, 2), (1, 1))

plt.show()
Output:
Method 7: Using Subplot Mosaic
Matplotlib also provides a subplot_mosaic() function that allows you to create complex layouts of subplots with custom spacing. By specifying the layout of the subplots using a dict-like structure, you can easily control the spacing between subplots.
Here is an example code snippet that demonstrates how to use subplot_mosaic() to increase the spacing between subplots:
import matplotlib.pyplot as plt

fig = plt.figure()

spec = fig.add_gridspec(ncols=2, nrows=2, width_ratios=[1, 2], height_ratios=[1, 2])
axs = fig.subplot_mosaic(spec)

plt.show()
Method 8: Using AxesDivider
The AxesDivider module in Matplotlib provides advanced functionality for creating complex layouts of subplots with custom spacing. By using the Divider class, you can control the spacing between subplots in a flexible and precise way.
Here is an example code snippet that showcases how to use AxesDivider to increase the spacing between subplots:
import matplotlib.pyplot as plt
from mpl_toolkits.axes_grid1 import Divider, Size

fig = plt.figure()

# Create custom divider
divider = Divider(fig, (0.1, 0.1, 0.8, 0.8),
                  horizontal=[Size.Fixed(0.5), Size.Fixed(0.1)],
                  vertical=[Size.Fixed(0.5), Size.Fixed(0.1)])

ax1 = fig.add_axes(divider.get_position(), adjustable='box', aspect=1)
ax2 = fig.add_axes(divider.get_position(), adjustable='box', aspect=1)

plt.show()
Output:
Method 9: Using subplotpars Parameter
The subplotpars parameter allows you to customize the spacing between subplots by adjusting the default subplot parameters. By setting the left, right, bottom, and top values in the rcParams dictionary, you can control the spacing between subplots globally.
Here is an example code snippet that demonstrates how to use the subplotpars parameter to increase the spacing between subplots:
import matplotlib.pyplot as plt
import matplotlib as mpl

# Adjust default subplot parameters
mpl.rcParams['figure.subplot.left'] = 0.2
mpl.rcParams['figure.subplot.right'] = 0.8
mpl.rcParams['figure.subplot.bottom'] = 0.2
mpl.rcParams['figure.subplot.top'] = 0.8

fig, axs = plt.subplots(2, 2)

plt.show()
Output:
Method 10: Using set_subplotspec Function
The set_subplotspec() function allows you to adjust the spacing between subplots by modifying the layout specification of the subplots. By specifying the subplotspec parameter when creating subplots, you can control the spacing between them.
Here is an example code snippet that shows how to use set_subplotspec() function to increase the spacing between subplots:
import matplotlib.pyplot as plt

fig = plt.figure()
subplotspec = fig.add_gridspec(2, 2).subplotspec[0, 0]

ax1 = fig.add_subplot(subplotspec)
ax2 = fig.add_subplot(subplotspec)

plt.show()
In conclusion, there are multiple methods available in Matplotlib to increase the spacing between subplots. These methods offer flexibility and control over the layout of subplots, allowing you to create visually appealing plots with adequate spacing betweenthem. Whether you prefer adjusting subplot parameters, using GridSpec, tight layout, manual positioning, or other advanced techniques like AxesDivider and subplot_mosaic, you can effectively increase the spacing between subplots in Matplotlib to meet your specific requirements.
By experimenting with these different methods and customizing the spacing between subplots, you can create visually engaging plots that effectively present your data and insights. Remember to consider the overall layout of your plots and the spatial relationships between subplots to ensure a cohesive and well-organized presentation.
In conclusion, increasing the spacing between subplots in Matplotlib is a practical way to enhance the visual appeal and readability of your plots. With the various techniques and methods available, you have the flexibility to customize the spacing between subplots to suit your needs and create professional-looking plots for your data analysis and visualization projects. Experiment with these methods and choose the one that best fits your requirements to elevate the quality of your visualizations.