Line Style in Matplotlib
In Matplotlib, line style refers to the pattern used to draw a line when plotting data. Line style can be customized to create different effects in plots. In this article, we will explore various line styles available in Matplotlib and how to use them in your plots.
1. Solid Line
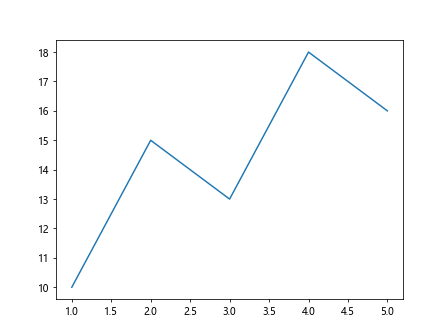
A solid line is the default line style used in Matplotlib. It is represented by a continuous line without any breaks.
import matplotlib.pyplot as plt

x = [1, 2, 3, 4, 5]
y = [10, 15, 13, 18, 16]

plt.plot(x, y, linestyle='-')
plt.show()
Output:
2. Dashed Line
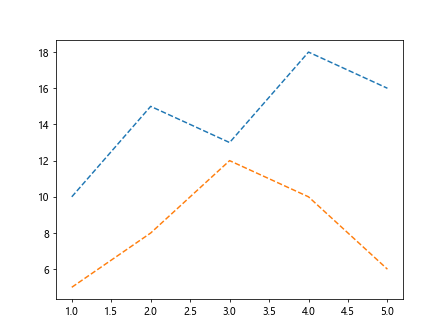
A dashed line consists of a series of short, evenly spaced dashes. It can be used to differentiate between multiple lines in a plot.
import matplotlib.pyplot as plt

x = [1, 2, 3, 4, 5]
y1 = [10, 15, 13, 18, 16]
y2 = [5, 8, 12, 10, 6]

plt.plot(x, y1, linestyle='--')
plt.plot(x, y2, linestyle='--')
plt.show()
Output:
3. Dotted Line
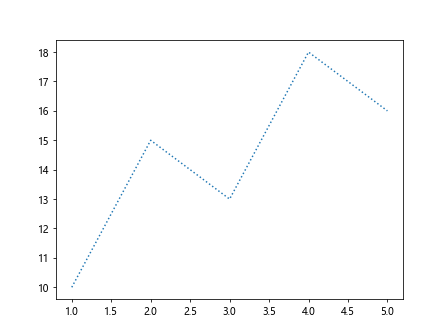
A dotted line is made up of a series of closely spaced dots. It can be used to draw attention to specific points in a plot.
import matplotlib.pyplot as plt

x = [1, 2, 3, 4, 5]
y = [10, 15, 13, 18, 16]

plt.plot(x, y, linestyle=':')
plt.show()
Output:
4. Dash-Dot Line
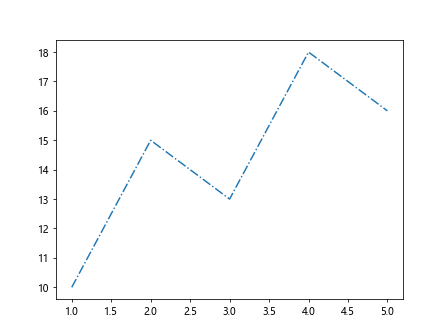
A dash-dot line combines the features of both dashed and dotted lines. It consists of a repeating pattern of dash-dot.
import matplotlib.pyplot as plt

x = [1, 2, 3, 4, 5]
y = [10, 15, 13, 18, 16]

plt.plot(x, y, linestyle='-.')

plt.show()
Output:
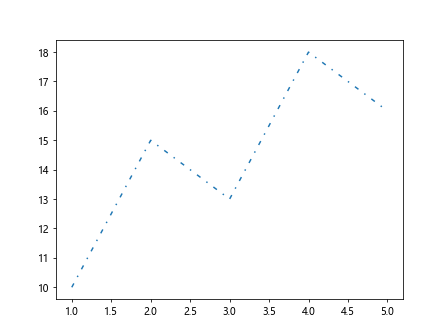
5. Short Dash Line
A short dash line is similar to a dashed line but with shorter dashes. It can be used for a more subtle differentiation between lines.
import matplotlib.pyplot as plt

x = [1, 2, 3, 4, 5]
y = [10, 15, 13, 18, 16]

plt.plot(x, y, linestyle=(0, (3, 5, 1, 5)))
plt.show()
Output:
6. Long Dash Line
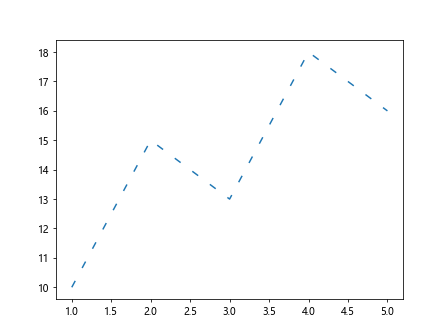
A long dash line is similar to a dashed line but with longer dashes. It can be used for a more pronounced differentiation between lines.
import matplotlib.pyplot as plt

x = [1, 2, 3, 4, 5]
y = [10, 15, 13, 18, 16]

plt.plot(x, y, linestyle=(0, (5, 10)))
plt.show()
Output:
7. Custom Dash Pattern
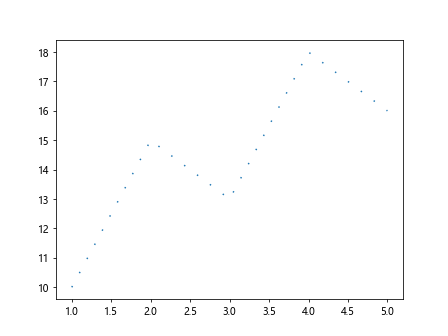
You can also create custom dash patterns for lines in Matplotlib by specifying a sequence of on-off lengths.
import matplotlib.pyplot as plt

x = [1, 2, 3, 4, 5]
y = [10, 15, 13, 18, 16]

plt.plot(x, y, linestyle=(0, (1, 10)))
plt.show()
Output:
8. Line Width
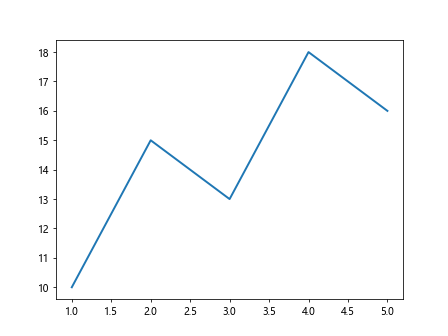
In addition to line style, you can also customize the line width in Matplotlib. A thicker line can make the plot more visually appealing.
import matplotlib.pyplot as plt

x = [1, 2, 3, 4, 5]
y = [10, 15, 13, 18, 16]

plt.plot(x, y, linestyle='-', linewidth=2)
plt.show()
Output:
9. Line Color
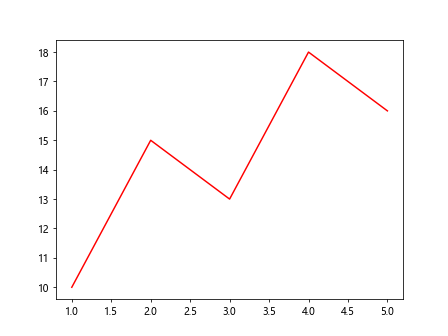
You can further customize the appearance of the line by changing its color. Matplotlib supports a wide range of colors for lines.
import matplotlib.pyplot as plt

x = [1, 2, 3, 4, 5]
y = [10, 15, 13, 18, 16]

plt.plot(x, y, linestyle='-', color='red')
plt.show()
Output:
10. Line Style with Markers
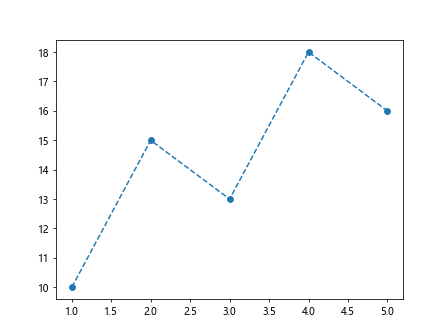
You can combine line styles with markers in Matplotlib to highlight data points on the plot.
import matplotlib.pyplot as plt

x = [1, 2, 3, 4, 5]
y = [10, 15, 13, 18, 16]

plt.plot(x, y, linestyle='--', marker='o')
plt.show()
Output:
Conclusion
In this article, we have explored various line styles available in Matplotlib and how to customize them in your plots. By using different line styles, widths, colors, and markers, you can create visually appealing and informative plots for your data visualizations. Experiment with different combinations to find the best representation for your data.